
Abstract
Angiotensin-converting enzyme 2 (ACE2) is the main entry point in airway epithelial cells for SARS-CoV-2. ACE2 binding to the SARS-CoV-2 protein spike triggers viral fusion with the cell plasma membrane, resulting in viral RNA genome delivery into the host. Despite ACE2’s critical role in SARS-CoV-2 infection, full understanding of ACE2 expression, including in response to viral infection, remains unclear. ACE2 was thought to encode five transcripts and one protein of 805 amino acids. In the present study, we identify a novel short isoform of ACE2 expressed in the airway epithelium, the main site of SARS-CoV-2 infection. Short ACE2 is substantially upregulated in response to interferon stimulation and rhinovirus infection, but not SARS-CoV-2 infection. This short isoform lacks SARS-CoV-2 spike high-affinity binding sites and, altogether, our data are consistent with a model where short ACE2 is unlikely to directly contribute to host susceptibility to SARS-CoV-2 infection.
Main
With more than 53 million confirmed cases of COVID-19 and 1.3 million associated deaths worldwide (World Health Organization, 13 November 2020), there is an urgent need to understand the molecular mechanism of infection and disease to identify patients’ susceptibilities and targets for therapeutic intervention.
ACE2 is the main viral entry point for coronavirus N63, SARS-CoV and SARS-CoV-2, which cause severe acute respiratory syndromes, the last being responsible for COVID-19 in humans1,2,3,4. ACE2 binds to the S1 domain of trimeric SARS-CoV spike (S) glycoprotein1 and SARS-CoV-2 S protein5, which is primed by TMPRSS2 (ref. 6). Cellular entry of SARS-CoV is dependent on the extracellular domain of ACE2 being cleaved by TMPRSS2 protease at Arg 697 and Lys 716, and the transmembrane domain of ACE2 internalized with the virus7,8,9.
ACE2 is a carboxypeptidase with several known physiological functions including regulation of blood pressure, salt and water balance in mammals10,11, amino acid uptake in the small intestine12,13, and glucose homeostasis and pancreatic β-cell function14,15. Interestingly, ACE2 has been suggested to play an important role in protection from acute lung injury16,17,18,19.
ACE2 expression in different tissues is controlled by multiple promoter elements20,21,22. In human nasal epithelia and lung tissue, ACE2 expression has been reported to be interferon (IFN) regulated, with evidence of STAT1-, STAT3-, IRF8- and IRF1-binding sites within the ACE2 promoter23. Activation of IFN-responsive genes is an important antiviral defense pathway in humans, and both interferon and influenza exposure have been reported to increase ACE2 expression in the human airway23.
Bulk and single-cell RNA-sequencing (scRNA-seq) data24 detect low-level expression of ACE2 in multiple tissues25. ACE2 expression in the airways is relatively high in nasal epithelium and progressively lower in the bronchial and alveolar regions; this expression profile correlates with levels of infection of SARS-CoV-2 isolates from patients in different airway compartments26. Consistently, SARS-CoV-2 viral loads have been found to be higher in swabs taken from the nose than swabs taken from the throat of COVID-19 patients27. Highest ACE2 expression is seen in goblet and ciliated cells of the nasal epithelium25, and ACE2 protein localizes to the membrane of motile cilia of respiratory tract epithelia28. Consistent with this, SARS-CoV-2 has been detected in situ in ciliated airway cells and upper airway epithelium, in addition to pulmonary pneumocytes, in COVID-19 patients examined post mortem29. Airway multiciliated cells appear to be one of the main targets of SARS-CoV-2 infection26, and it has been demonstrated that SARS-CoV infection occurs through ACE2 on cilia in airway epithelia28. Altogether, these studies have established the upper airway as the main site of SARS-CoV-2 infection.
In the present study, we detail the identification of a new isoform of ACE2, which we name short ACE2, that is expressed in human nasal and bronchial respiratory epithelia, the main site of SARS-CoV-2 infection, and is preferentially expressed in asthmatic bronchial epithelium relative to full-length ACE2 (long ACE2). In primary airway cells, short ACE2 is upregulated in response to IFN treatment and infection with rhinovirus, but not SARS-CoV-2.
Results
Identification of new short ACE2 transcript
We analyzed the expression of ACE2 in airway epithelia in our existing RNA-seq datasets obtained from nasal brushings and nasal epithelium cultured at the air–liquid interface (ALI). Visual analysis of alignment to the ACE2 gene region identified multiple reads mapping to a genomic region between exons 9 and 10 of the GENCODE v.33 ACE2 gene build with a discrete 3′-junction at GRCh38 chrX:15580281, suggesting a splice junction with downstream exon 10. Variable 5′-length indicated no splicing upstream of exon 8, suggesting a new ACE2 transcript starting with a new exon, which we call exon 9a, in the airway (Fig. 1a). Analysis of these RNA-seq data, with code developed by Cummings et al.30, also independently detected a new splice junction at chrX:15580281. Analysis of splice junctions identified by STAR31 aligner confirmed multiple uniquely mapped reads to a new exon/exon boundary removing a new intron of coordinates GRCh38 chrX:15578316–15580280. Assembly of transcriptomes using the SCALLOP tool independently identified this novel ACE2 transcript, including exon 9a to exon 19 (Fig. 1a). Analysis of relative expression of the short and full-length (long) ACE2 transcripts in these RNA-seq data showed that, in primary nasal epithelial cells, short ACE2 expression is significantly higher than long ACE2 expression (Fig. 1b). Study of the sequence of the exon 9a/intron boundary showed a strong U1-dependent consensus splice site sequence (AG|GTAAGTA), suggesting that it is a strong splice donor site (Fig. 1a). This splicing event introduces a new, in-frame ATG start codon 29 nucleotides (nt) upstream of the splice site (Fig. 1a), and a TATA box 148 nt upstream of the splice site (Fig. 1a), suggesting that this transcript is protein coding. Furthermore, a promoter flanking region has been identified at GRCh38 chrX:15581200–15579724 (ENSR00000902026), suggesting active transcription upstream of exon 9a (approximately chrX:15580402–chrX:15580281). Analysis of this region shows a near-consensus ISGF-3-binding site (TgGTTTCAgTTTCCt)32 159 bp upstream of the splice junction, a near-consensus AP-1-binding site (TGtGTCA)33 223 bp upstream of the splice site and an NF-κB-binding site (GGGTTTTCCC)34 787 bp upstream of the splice junction. This suggests that short ACE2 is under independent transcriptional control from full-length ACE2 expression, and that this may be controlled by IFN, AP-1 and NF-κB (nuclear factor κ-light-chain-enhancer of activated B cells) elements.
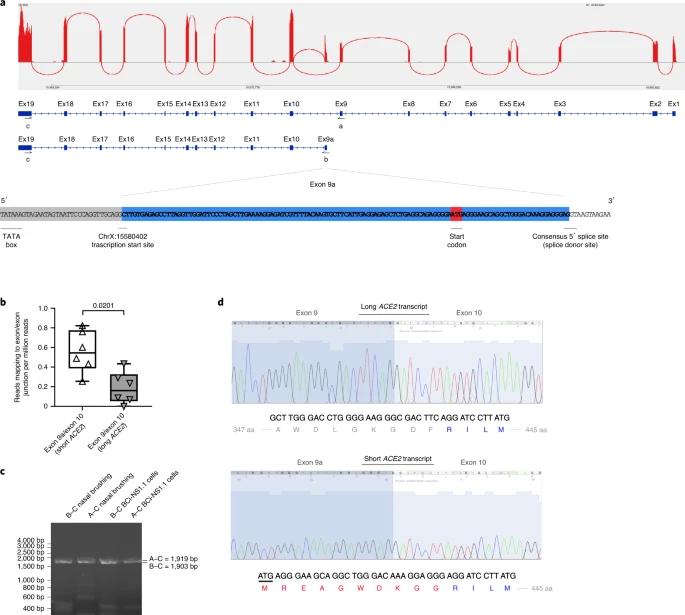
a, Sashimi plot showing splice junction between exons (Ex) 9 and 10, and between exons 9a and 10, counted from RNA-seq reads from one nasal brushing sample. GENCODE v.33 gene build exons and new SCALLOP transcriptome build exons, showing new exon 9a in a new transcript encompassing exons 9a–19, assembled by SCALLOP tool. Letters ‘A’, ‘B’ and ‘C’ indicate locations of primers for RT–PCR (Fig. 1c). Nucleotide sequence of novel exon 9a, plus 5′ UTR, start codon and splice junction, are shown. b, Box and whisker plot showing expression levels of short and long ACE2 transcripts in primary NECs (reads mapped to exon 9a/10 or exon 9/10 per million mapped reads) (P = 0.0201, paired, two-way Student’s t-test; n = 6 donors). c, Agarose gel electrophoresis image of long-range, transcript-specific PCR products amplifying full short ACE2 transcript and exons 9–19 of long ACE2 transcript from nasal epithelial brushings and BCi-NS1.1 cells, using different pairs of primers (A and C or B and C), specific to regions of ACE2 shown in a. d, Sanger sequencing electropherogram traces showing sequence at exon/exon boundaries of long ACE2 transcript exons 9–10 and short ACE2 transcript exons 9a–10. Amino acid (aa) translation is shown below.
Expression of this new transcript was confirmed by reverse transcriptase (RT)–PCR using primers specific to exons 1, 9a and 19 and complementary DNA from both nasal brushings and differentiated immortalized bronchial epithelial cells, BCi-NS1.1, which differentiate robustly into airway multiciliated cells35 (Fig. 1c). Sanger sequencing confirmed the identity of these PCR amplicons (Fig. 1d).
We then designed specific quantitative PCR (qPCR) primers to amplify the short and long transcripts of ACE2 individually, as well as primers to amplify both transcripts and to quantify total levels of ACE2 expression (Extended Data Fig. 1a,b). Expression of long ACE2 was confirmed in a number of cell lines and primary airway cells, with the highest expression being observed in the Vero E6 cell line, differentiated BCi-NS1.1 cells and in vitro differentiated nasal epithelial cells grown at ALI, with expression comparable to that observed in ex vivo nasal epithelial cells (NECs) (Fig. 2a,b). Expression of short ACE2 was low in Vero E6, HEK293, Caco2, RPE1, H441 and 16HBE cells, and this contrasted with differentiated BCi-NS1.1 cells and ex vivo or in vitro differentiated nasal cells, which exhibited high expression of this new isoform. Both isoforms were also expressed robustly in ex vivo or in vitro differentiated primary bronchial cells (Fig. 2a,b). Assessment of ACE2 isoform expression during differentiation of NECs grown at ALI in vitro showed very low ACE2 expression on day 1, with expression of both isoforms reaching levels comparable with those observed in primary nasal brushings at day 4 of ALI culture, when the start of cilia gene transcription is observed (usually days 4–7), being maintained until day 63 and reducing at day 84 as the cultures became senescent (Fig. 2c and Extended Data Fig. 2). This is consistent with published work showing that ACE2 expression (and SARS-CoV-2 infection) is dependent on airway epithelial cell differentiation36. Given reports that bronchial epithelial cells express lower levels of ACE2 than nasal cells23, we also compared expression of the long and short isoforms of ACE2 in these two cell types from multiple donors of primary tissue. Consistent with previous reports, total levels of ACE2 were lower in bronchial epithelial cells, which was due to reduced expression of both long and short forms of ACE2 (Fig. 2d).
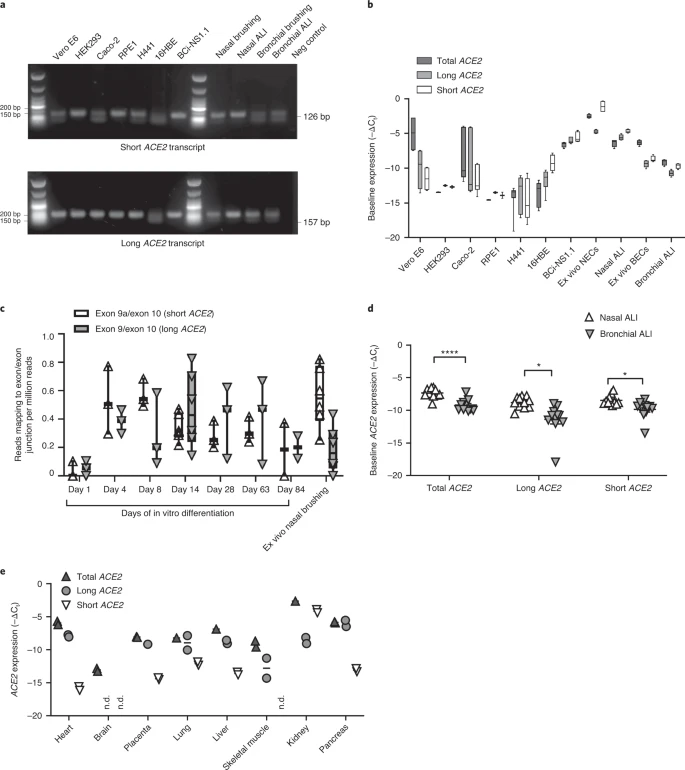
a, Representative agarose gel electrophoresis image of transcript-specific ACE2 RT–PCRs (n = 3) from different cell types. Size standard = NEB low-molecular-mass ladder. b, Box and whisker plots showing 5th to 95th percentiles (whiskers), median and quartiles (box) of baseline expression (−ΔCt) of total ACE2 (dark gray), long ACE2 (light gray) and short ACE2 (white) in cell lines and airway cells. Analysis was done at least in duplicate and from different passages or donors in all lines except RPE1 and HEK293 cells (analysis done in duplicate from one passage). c, Box and whisker plots showing 5th to 95th percentiles (whiskers), median and quartiles (box), plus individual data points showing relative expression (reads mapped to exon/exon boundary per million mapped reads) of short ACE2 transcript (white upward-pointing triangles) and long ACE2 transcript (gray downward-pointing triangles) in RNA-seq data from NECs at different stages of differentiation at ALI (days 1, 4, 8, 14, 28, 63 and 84; n = 3 donors for each time point) and primary ex vivo nasal brushings (n = 6 donors). d, Medians and individual data points showing baseline expression (−ΔCt) of total ACE2 transcripts, long ACE2 transcript and short ACE2 transcript in nasal (white upward-pointing triangles, n = 11 donors) and bronchial (gray downward-pointing triangles, n = 11 donors) ALI cultures from healthy donors, as determined using transcript-specific qPCR. Data were analyzed using the Mann–Whitney U-test. e, Medians and individual data points showing baseline expression (−ΔCt) of total ACE2 (dark gray upward-pointing triangles), long ACE2 (light gray circles) and short ACE2 (white downward-pointing triangles) transcript in a multiple tissue cDNA panel 1 (636742, TakaraBio), as determined using transcript-specific, probe-based ACE2 RT–qPCR. ND, not detected; n = 2 independent experiments.
Short ACE2 transcript is expressed in multiple tissues
Transcript-specific, probe-based qPCR on cDNA from a multiple tissue control panel showed robust expression of the long transcript of ACE2 in all tissues tested except whole brain (Fig. 2e). The short transcript of ACE2 was detected in all tissues except whole brain and skeletal muscle, although the expression level was low in most tissues, with the highest expression in lungs and kidneys (Fig. 2e).
Short ACE2 lacks most of the SARS-CoV-2-binding interface
We modeled the structure of the predicted translation product of this short transcript of ACE2, based on the structure of full-length long ACE2 protein as a complex with the receptor-binding domain of SARS-CoV-2 resolved by cryo-electron microscopy (cryo-EM) (Protein Data Bank (PDB) 6M17)4. This analysis highlighted the extent of loss of the SARS-CoV-2-binding region in the predicted protein product of short ACE2, with many residues previously shown to be important for viral binding not present in this short ACE2 protein (Extended Data Fig. 3a–c). Assuming that the homologous parts of short ACE2 fold in the same way as full-length ACE2, molecular dynamic simulation of a short ACE2 homodimer suggested that it may form a stable structure (Extended Data Fig. 3d–f and Supplementary Video 1).
Short ACE2 is detected in differentiated airway epithelia
To investigate whether short ACE2 encodes a protein isoform in airway epithelial cells and other cell types, we performed western blotting analysis of cell lysates using multiple antibodies to ACE2 recognizing epitopes on different regions of the protein (Fig. 3a). Initially, we tested an antibody raised to the C-terminal domain (CTD) of ACE2 (anti-ACE2 CTD), which we anticipated would recognize a common epitope in long and short ACE2. Western blotting of lysates prepared from seven cell lines including Vero cells, which are used for infection assays of SARS-CoV37 and SARS-CoV-2 (ref. 38), identified 2 bands at 100 and 120 kDa, consistent with the presence of glycosylated and nonglycosylated forms of full-length (long) ACE2 protein1 (see below). We also detected an additional band at ~52 kDa, the expected molecular mass of short ACE2, in differentiated BCi-NS1.1 cells (Fig. 3b), and fully differentiated primary nasal and bronchial epithelial cultures (Fig. 3c). Expression of this protein in other cell lines was low, consistent with the qPCR data (Fig. 3b). Lack of correlation between long ACE2 protein levels and the intensity of the 52-kDa band suggests that the latter is not a degradation product of long ACE2. Preadsorption of the anti-ACE2 CTD antibody with the immunizing peptide, but not a peptide with a similar charge, blocked detection of both long and short ACE2 isoforms in the airway cells, confirming specific detection of short ACE2 (Fig. 3c).
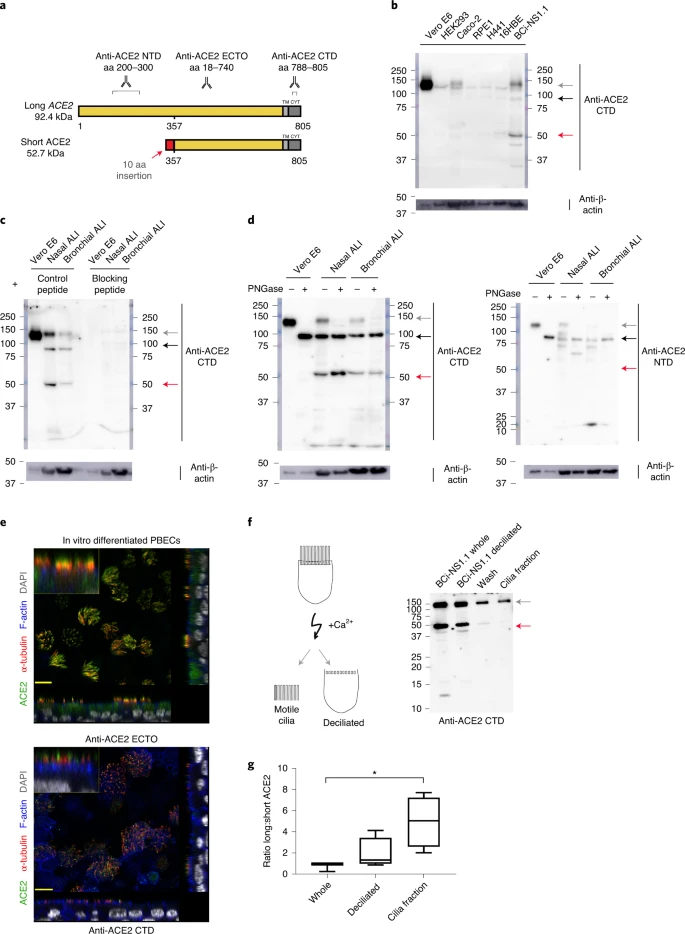
a, Schematic illustration of predicted long and short ACE2 protein isoforms and positions of antigen sequences used to generate the antibodies used; aa, amino acid. b, Representative western blots (n = 3 independent experiments) of Vero E6, HEK293, Caco2, RPE1, H441, 16HBE and BCi-NS1.1 cell line lysates immunoblotted with the anti-ACE2 CTD. c, Representative western blot of Vero E6, in vitro differentiated primary NEC and PBEC lysates, immunoblotted with anti-ACE2 CTD preadsorbed with the immunizing (blocking) peptide (right; n = 3 independent experiments) or similar charged control peptide (left; n = 1 independent experiment). d, Representative western blots (n = 3 independent experiments) of Vero E6 cells and in vitro differentiated nasal and bronchial cell lysates incubated with or without PNGase F, blotted with anti-ACE2 CTD (left panel) and anti-ACE2 NTD (right panel) antibodies. e, Representative immunofluorescence confocal images (n = 4 independent experiments) of in vitro differentiated PBECs stained with anti-α-tubulin (red), Alexa Fluor 555 phalloidin (blue), DAPI (gray) and ACE2 (green), detected with anti-ACE2 ECTO (top panel; antibody-detecting epitopes across the protein) or anti-ACE2 CTD (bottom panel). f, Schematic illustration of deciliation protocol using calcium shock (left) and western blot of whole and deciliated BCi-NS1.1 cells, deciliation wash and cilia pellet (right). g, Box and whisker plot of semiquantitative analysis of the western blots by densitometric analysis (n = 4 independent experiments). b–d and f, Gray arrow points to glycosylated long ACE2, black arrow to unglycosylated long ACE2 and red arrow to short ACE2.
To orthogonally validate antibody specificity, and examine glycosylation of the ACE2 isoforms, we performed additional western blot analyses on cell lysates of both nasal and bronchial epithelial ALI cultures, as well as Vero E6 cells before and after treatment with PNGase F, an enzyme that removes N-linked oligosaccharides from glycoproteins. This confirmed that the ~120-kDa band detected by the anti-ACE2 CTD antibody was glycosylated ACE2 whereas the ~100-kDa band was non (or partially) glycosylated ACE2; the mobility of the ~52-kDa band corresponding to short ACE2 did not change, suggesting that it is not N-glycosylated. Similar results were obtained with an antibody raised against the ectodomain of ACE2 (anti-ACE2 ECTO; amino acids 18–740), which recognized glycosylated and nonglycosylated isoforms of long ACE2, as well as short ACE2. In contrast, an ACE2 N-terminal domain antibody (anti-ACE2 NTD) raised against amino acids 200–300, which are present only in the N-terminal region of long ACE2 recognized glycosylated and nonglycosylated isoforms of long ACE2 but, as expected, it did not recognize short ACE2 (Fig. 3d). To examine the localization of the ACE2 isoforms in airway epithelial cells, we performed immunofluorescence staining of differentiated ALI cultures of primary bronchial epithelial cells (PBECs) with anti-ACE2 antibodies visualized by confocal microscopy (Fig. 3e and Extended Data Fig. 4a–d). The antibodies recognizing common epitopes in short and long ACE2 showed localization mainly to the cellular apical regions and motile cilia.
Thus, to further investigate whether short ACE2 localizes to cilia, as has been reported for full-length ACE2 (ref. 39), we purified motile cilia from BCi-NS1.1 cells. Consistent with our previous experiments, western blotting of whole cell lysates with anti-ACE2 CTD antibody showed a distinct band around 52 kDa, in addition to full-length ACE2 (Fig. 3f). Notably, the band corresponding to short ACE2 was not enriched in the cilia fraction albeit still present in detectable amounts (Fig. 3f), suggesting that it is predominantly localized to the apical regions of the cells. Densitometric analysis confirmed enrichment of long ACE2 in the cilia fraction relative to short ACE2 (Fig. 3g).
Cell-free protein synthesis assays of the ectodomains of long and short ACE2 confirmed that both constructs were expressed at comparable levels with little evidence of degradation (Extended Data Fig. 5a). However, no expression of a green fluorescent protein (GFP)-tagged short ACE2 construct was seen in mammalian cell lines except in the H441 airway cell line, suggesting that the stability of short ACE2 may be cell type dependent (Extended Data Fig. 5b).
INFs and RV infection upregulate short ACE2
To begin investigating the functional relevance of short ACE2 transcript expression, we first assessed whether it is an IFN-stimulated gene. As expected, treatment of bronchial epithelial cells with type I, II or III IFNs caused upregulation of MX1 and IP10 (Extended Data Fig. 6a,b) and upregulation of total ACE2 (Fig. 4a), which was largely due to an effect on short ACE2 rather than long ACE2 (Fig. 4a). In these experiments we observed effects of IFN-β > IFN-γ and IFN-λ > IFN-α in induction of short ACE2 expression (Fig. 4a); we also noted inhibitory effects of some of the IFNs on expression of long ACE2 (Extended Data Fig. 6c), such that only IFN-β caused a significant change in the ratio of short ACE2 relative to long ACE2 expression (Fig. 4a and Extended Data Fig. 6d). Based on the greater potency of IFN-β, we confirmed the induction of short ACE2 in differentiated bronchial epithelial cells treated with IFN-β (Extended Data Fig. 6e,f).

a–f, Box (median and quartiles) and whisker (5th to 95th percentiles) plots plus individual data points of relative expression (\(2^{-\Delta \Delta {\rm{C}}_{{\rm{t}}}}\)) of transcripts/genes measured by RT–qPCR. a, Relative expression of total (left), long (middle) and short (right) ACE2 transcripts in undifferentiated PBECs treated with IFN-α (n = 3 donors), IFN-β (n = 7 donors), IFN-γ (n = 4 donors) or IFN-λ (n = 4 donors) for 24 h at indicated doses. Data were analyzed using a two-tailed, Mann–Whitney U-test, compared with control. Total ACE2: IFN-α 1,000: P = 0.0083; IFN-β 100: P = 0.0006; IFN-β 1,000: P = 0.0006; IFN-γ 100: P = 0.030; IFN-γ 1,000: P = 0.0030; IFN-λ 100: P = 0.0030. Long ACE2: IFN-α 100: P = 0.0083; IFN-α 1,000: P = 0.0083; IFN-γ 1,000: P = 0.0030; IFN-λ 100: P = 0.0030. Short ACE2: IFN-β 100: P = 0.0006; IFN-γ 1,000: P = 0.030; IFN-λ 100: P = 0.0030. b,c, Relative expression of total, long and short ACE2 in in vitro differentiated NECs (n = 11 individual donors) (b) and PBECs (n = 13 individual donors) (c) 24 h after infection with RV16 or UV-RV16. Data were analyzed using a two-tailed Wilcoxon’s test, compared with UV-RV16. NECS: total ACE2: P = 0.0010; long ACE2: P = 0.0010; short ACE2: P = 0.0010. PBECs: total ACE2: P = 0.0010; long ACE2: P = 0.2510; short ACE2: P = 0.0007. d–f, Normalized expression of CoV-N1 (d), relative expression of ACE2 transcripts (e) and MX1 and IP10 (f) in differentiated BCi-NS1.1 cells 1 and 72 h after infection with SARS-CoV-2 strain nCoV/Victoria/1/2020 (n = 4 independent experiments). CoV-N1, MX1 and IP10 expression data were analyzed using paired, two-tailed Student’s t-test (CoV-N1, P = 0.0852). ACE2 data were analyzed using nonparametric, two-tailed, Wilcoxon’s test. g, Dot plot showing ratio of short to long ACE2 expression (Δshort–long −ΔCt) in in vitro differentiated PBECs from healthy (n = 13 donors) or severely asthmatic (n = 12 donors) donors 24 h after infection with RV16 or UV-RV16. The two-tailed Wilcoxon’s test was used for paired and the two-tailed Mann–Whitney U-test for unpaired samples. UV-RV16 versus RV16 in healthy controls: P = 0.0005; in severe asthma: P = 0.0020. UV-RV16 in healthy controls versus severe asthma: P = 0.0138; RV16 in healthy controls versus severe asthma: P = 0.0114. h, Dot plot showing correlation of relative expression of IFNB1 and short ACE2 (left) or long ACE2 (right) in response to RV16 infection. Data were analyzed using two-tailed Spearman’s rank correlation coefficient: short ACE2: r = 0.5765; P = 0.0032; long ACE2: r = 0.05391; P = 0.8024.
These data led us to evaluate the response to viral infection, because it has been reported that ACE2 expression is upregulated in this condition23. We exposed NECs grown at ALI to rhinovirus (RV16) and harvested cells 24 h after infection. The qPCR analysis showed a significant upregulation of both long and short ACE2 expression relative to UV-RV-treated controls (Fig. 4b). Although this is consistent with previously published work showing that ACE2 is upregulated in response to a ninefold increase in expression of short ACE2 compared with around a 2.5-fold increase in long ACE2 expression (Fig. 4b), parallel experiments using bronchial epithelial cells infected with RV16 confirmed that induction of short ACE2 but had no significant effect on long ACE2 (Fig. 4c).
We next sought to investigate the effect of SARS-CoV-2 infection on the expression of the short transcript of ACE2. Differentiated BCi-NS1.1 cells were infected with SARS-CoV-2 and harvested at 1 and 72 h after infection (Fig. 4d); however, we did not observe a significant induction of either the long or the short isoforms of ACE2, or total ACE2 (Fig. 4e). Despite the fact that BCi-NS1.1 cells can respond to RV16 infection with IFN production and induction of IFN-stimulated genes MX1 and IP10 (Extended Data Fig. 6g,h), we did not observe significant induction of MX1 or CXCL10 in the SARS-CoV-2-infected cultures (Fig. 4f), consistent with previously published data demonstrating the ability of SARS-CoV-2 to inhibit both IFN expression and downstream signaling from the type I IFN receptor40,41,42,43.
We next examined induction of short ACE2 in differentiated bronchial epithelial cultures from severe asthmatic donors who are known to have reduced type I and type III IFN responses to RV16 infection44,45. We observed a significant increase in expression of total ACE2 and short ACE2 but not long ACE2 when differentiated bronchial epithelial cultures from either healthy control individuals or people with severe asthma were infected with RV16 (Extended Data Fig. 7a,b). This resulted in a significant increase in the ratio of short ACE2 relative to long ACE2 (Fig. 4g and Extended Data Fig. 7c); however, for the severe asthma-derived cultures this increase was significantly less than that observed in cultures from healthy donors (Fig. 4g). The RV16-induced increase in short ACE2 expression was positively correlated with expression of IFNB1 (Fig. 4h), whereas there was no similar relationship for long ACE2 expression. Furthermore, as we observed previously44, RV-induced IFN-λ (interleukin (IL)-29/28) secretion was lower in the severe asthma-derived cultures (Extended Data Fig. 7d) and levels of IFN-λ were significantly correlated with expression levels of short ACE2 but not long ACE2 (Extended Data Fig. 7e).
Finally, as ACE2 expression has been reported to be elevated in some patients with severe asthma who exhibit type I and II IFN signatures as a phenotypic trait46, we analyzed expression of long and short ACE2 in bronchial brushings from healthy controls and patients with severe asthma who were free of respiratory virus infections. This showed statistically significantly lower expression of total ACE2 and long ACE2 in patients with severe asthma, but no significant difference in short ACE2 expression between groups (Extended Data Fig. 7f). As a consequence, the ratio of short ACE2 to long ACE2 was significantly higher in patients with severe asthma (Extended Data Fig. 7g). In these severe cases, the expression of the IFN-stimulated genes OAS1 and ISG15 was significantly elevated (Extended Data Fig. 7h), and short ACE2 expression levels significantly correlated with IFN-γ protein levels in bronchoalveolar lavage (BAL) fluid (Extended Data Fig. 7i), suggesting that variation in expression of ACE2 isoforms in vivo may reflect the inflammatory status in asthma, independently of a virus-induced exacerbation.
Discussion
In the present study, we present identification and characterization of a short 11-exon transcript of human ACE2, consisting of a new previously unannotated (at the time of analysis) first exon, which we name exon 9a, and exons 10–19 of the long ACE2 transcript. We show that, although the long transcript of ACE2 is expressed in multiple tissues, this short ACE2 transcript is expressed predominantly in the airways. We show highest expression in primary respiratory epithelia, most notably in the nasal epithelium where the level of short transcript expression is higher than long ACE2 transcript expression. Expression of both transcripts of ACE2 depends on the differentiation of epithelial cells, with levels of expression comparable with primary nasal epithelia from days 4–63 of differentiation at ALI culture. We show that expression of this short transcript is regulated independently of the long transcript of ACE2, with putative promoter elements identified upstream of the transcriptional start site of the short ACE2 transcript. We confirm that this short transcript is translated into a protein product of around 52 kDa, which is not glycosylated in differentiated airway epithelial cells. Although the transcript lacks a signal peptide, recombinant protein expression studies confirm that the short ACE2 transcript can be translated into a protein product in vitro; however, within cells its expression appears to be relatively unstable. As is the case for other unstable proteins, this may be because the standard cell lines used for expression studies are not equipped to accomplish the required post-translational modifications or molecular folding of this molecule. In parallel with our studies, two independent reports identified the novel ACE2 transcript by extensive mining of public datasets47,48; however, endogenous protein expression of the short ACE2 isoform was not detected in a range of cell lines or undifferentiated PBECs by either study. Thus, detailed studies of short ACE2 function may require use of airway cell systems, especially differentiated cell models where short ACE2 appears more abundant, perhaps reflecting a stabilizing environment.
Previous studies have reported that ACE2 is an IFN-regulated gene and suggested that SARS-CoV-2 can exploit IFN-driven upregulation of ACE2 to enhance infection23. In our study, we show that it is the short transcript of ACE2 that is more strongly induced by type I, II and III IFNs and by viral infection than long ACE2, findings similar to two recent reports47,48. In our study, we performed detailed comparative dose–response studies and found that short ACE2 was not only upregulated by IFN-β and IFN-λ, reflecting innate epithelial responses to infection, but also by IFN-γ and, to a much lesser extent, IFN-α, suggesting a further contribution from co-resident immune cells such as T cells and plasmacytoid dendritic cells in vivo. Although we observed a small increase in long ACE2 expression in RV16-infected NECs, it seems unlikely that this was due to virus-induced IFN production, as we observed either no effect or an inhibitory effect of IFNs on long ACE2 expression. Given that viral infection also induces expression of cytokines such as IL-1β, which has been reported to induce ACE2 expression49, it seems more likely that cytokines other than IFNs induce long ACE2, the viral receptor form of ACE2. Given the absence of key residues required for SARS-CoV-2 spike binding and the evidence that short ACE2 cannot bind SARS-CoV-2 spike protein48, it is unlikely that IFNs have a detrimental effect in the airways by promoting SARS-CoV-2 entry, as has been suggested previously23. Such a conclusion is supported by a recent clinical trial of inhaled IFN-β in hospitalized patients who showed greater odds of clinical improvement and recovery, as well as reduced breathlessness compared with placebo50, thus highlighting the antiviral benefits of IFN-β.
Although patients with asthma have reduced susceptibility to SARS-CoV-2, and asthma symptoms are not exacerbated by SARS-CoV-2 infection51,52,53, it has been reported that ACE2 expression is higher in bronchial epithelium of a subset of asthma patients with type 2 low disease and characteristics resembling known risk factors for severe COVID-19 (ref. 46). As this increase in ACE2 expression was found to be associated with upregulation of viral response genes, it was suggested that therapies targeting the IFN family may be of benefit in this subset of patients46. Through analysis of ACE2 isoforms, our data show that long ACE2 expression is lower in people with severe asthma compared with healthy controls, even though we were able to identify upregulation of certain IFN-responsive genes in the asthma group. In contrast, expression of short ACE2 was comparable between the groups, and there was a higher ratio of expression of short ACE2:long ACE2 in severe asthma. It seems likely that this is linked to the inflammatory status of the airways and does not place people with asthma at greater risk of SARS-CoV-2 infection.
Of note, we did not observe induction of a short ACE2 in response to SARS-CoV-2 infection of differentiated airway epithelial cells, a model that closely mimics the route of infection in humans. This finding is similar to that reported for SARS-CoV-2 infection of Calu3 lung adenocarcinoma cells, and is distinct from responses in intestinal epithelial cells where short ACE2 was induced by SARS-CoV-2 infection48. These differences may reflect differences in infection levels and/or the ability of SARS-CoV2 to suppress IFN expression and signaling40,41,42,43; however the possibility of cell-type differences requires further consideration, especially as the airways are the primary route of SARS-CoV-2 infection.
The discovery of short ACE2 may have important consequences for the design of therapeutic approaches targeting ACE2 to tackle COVID-19 (refs. 54,55) and has implications for the numerous studies reporting on ACE2 expression levels and differences in levels of expression along airways, and across age groups and disease groups26,46,56,57 including COVID-19 disease severity57,58. This finding should be considered when selecting reagents for future studies of ACE2 expression in tissues relevant to SARS-CoV-2 viral infection, bearing in mind the genomic region targeted by primer sets and the epitopes recognized by antibodies.
In conclusion, we have identified short ACE2, a new isoform of ACE2 predominantly expressed in differentiated airway epithelial cells, especially in cells of the upper airways, which are the main site of SARS-CoV-2 infection. Our data suggest that the transcript encodes a 52-kDa protein that can be detected in airway epithelial cells, although, because it lacks a signal peptide, it may be a relatively unstable protein. We demonstrate that it is this isoform, rather than full-length ACE2, that is IFN regulated and inducible on RV infection. However, in conditions of IFN suppression, as observed during SARS-CoV-2 infection, or IFN-β deficiency, as in asthma, short ACE2 is not induced to the same degree as normal. Although the function of short ACE2 is unknown, its regulation by IFN suggests that it may play an essential role in innate antiviral defense mechanisms in the airways.
Methods
Collection of airway samples
NECs were isolated by brushing the inferior turbinate with a sterile 3.0-mm cytology brush (Conmed). Cells were processed into RNA later for subsequent RNA-seq analysis or were stored in liquid nitrogen before cell culture. Bronchial epithelial cells were harvested by bronchoscopic brushings for PBEC culture. To assess inflammatory status some individuals underwent BAL at the time of bronchoscopy. Cytokines in BAL fluid supernatants were analyzed using a V-PLEX Proinflammatory Panel 1 Human Kit (Meso Scale Diagnostics). Airway samples for the study were collected following approval by South-Central Hampshire A, Research Ethics Committee, UK (reference nos. 07/Q1702/109, 13/SC/0182 and 14/WM/1226) and all participants gave their informed consent.
Cell culture
Nasal cells were expanded and differentiated at ALI culture as previously described59. All cultureware was pre-coated in 1:10 diluted PureCol collagen (5005-B CellSystems) throughout each step. Cells were cultured using Pneumacult Ex-Plus (Stemcell Technologies) and at ALI on 6.5-mm, 0.4-µm polyester membrane, Transwell permeable supports (Corning Life Sciences) for up to 84 d using Pneumacult ALI media (Stemcell Technologies), with apical surface washed (in Hanks’ Balanced Salt Solution (HBSS)) and medium changes three times weekly. Cell were cultured in 100% relative humidity and 5% CO2 at 37 °C. First ciliation was observed by microscopy from day 7 at ALI and maintained until harvested. Primary NECs were fully differentiated and ciliated by 28 d.
PBECs were expanded in airway epithelial cell growth medium (Promocell) up to passage 1 as previously described60. At passage 2, cells were either cultured submerged as monolayers or differentiation was induced by plating cells on 6.5-mm, 0.4-µm polyester membrane, Transwell permeable supports (Corning Life Sciences) and differentiated at ALI for 21 d. Transepithelial electrical resistance (TER) was monitored weekly using an EVOM Voltohmmeter (World Precision Instruments) and cells with a TER ≥ 330 W Ω m2 on day 21 were used for experiments.
The hTERT transformed bronchial epithelial cell line BCi-NS1.1, provided by Walters et al.35,61, was expanded in PneumaCult-Ex Plus Basal Medium (Stemcell Technologies) supplemented with Pneumacult Ex Plus supplements (Stemcell Technologies), hydrocortisone, nystatin and penicillin–streptomycin. BCi-NS1.1 cells were grown at an ALI in PneumaCult-ALI Basal Medium (Stemcell Technologies) supplemented with Pneumacult ALI supplement (Stemcell Technologies), hydrocortisone, PneumaCult ALI maintenance supplement, heparin, nystatin and penicillin–streptomycin. BCi-NS1.1 cell ciliation was observed by microscopy and cells were fully differentiated and ciliated by 42 d at ALI.
Vero E6 (ECACC Vero C1008) cells were cultured in Dulbecco’s modified Eagle’s medium (DMEM) supplemented with 10% fetal calf serum (FCS) and penicillin–streptomycin (Gibco) at 37 °C with 5% CO2. When 70–80% confluent (every 5–7 d), cells were passaged by washing with HBSS before detaching with 0.2% trypsin ethylenediaminetetraacetic acid (EDTA).
NCI-H441 (H441; American Type Culture Collection (ATCC) HTB-174) cells were cultured in RPMI 1640 medium (Gibco) supplemented with 10% FCS, sodium pyruvate, l-glutamine and penicillin–streptomycin at 37 °C with 5% CO2, and passaged every 3–4 d. Cells were washed with modified HBSS with calcium and magnesium (HyClone) before detaching with 0.2% trypsin EDTA.
The hTERT RPE-1 (ATCC CRL-4000) cells were cultured in DMEM/F12 medium (Gibco) supplemented with 10% FCS at 37 °C with 5% CO2, and passaged every 4–6 d.
The 293 (HEK293; ATCC, catalog no. CRL-1573) cells were cultured in DMEM high glucose supplemented with 10% FCS at 5% CO2 and passaged every 4–6 d at a ratio of 1:8.
RNA extraction and quality control for RNA-seq
RNA was extracted from nasal brushings and primary NECs grown at ALI using RNeasy Plus Mini kit (QIAGEN). RNA was extracted from epithelial brushings using miRNeasy Mini Kit and RNase-Free DNase Set (QIAGEN). RNA quality and concentration were measured using an RNA Nano chip on the Bioanalyzer 2100 (Agilent). Samples with total RNA concentration ≥20 ng µl−1, RNA integrity number ≥9.6 and optical density at 260/280 nm were taken forward for cDNA library preparation and sequencing.
The cDNA library preparation, sequencing and data quality control
Libraries of cDNA from primary nasal epithelial brushings and primary NECs grown at ALI were prepared using a Ribo-Zero Magnetic Kit for ribosomal RNA depletion and NEBNext Ultra Directional RNA Library Prep Kit library prep kit by Novogene Inc. These libraries from primary bronchial brushings were prepared using NEBNext Ultra (nonstranded) messenger RNA library prep kit with poly(A) pulldown for mRNA enrichment. Library quality was assessed using a broad-range DNA chip on the Agilent 2100 Bioanalyzer. Library concentration was assessed using Qubit and qPCR. Libraries were pooled and paired-end 150-bp sequencing to a depth of 20–100 million reads per sample was performed on an Illumina HiSeq2500 by Novogene Inc.
Raw FASTQ reads were subjected to adapter trimming and quality filtering (reads containing n > 10%, reads where >50% of read have a Q score ≤ 5) by Novogene Inc.
Quality of sequence was assessed using FastQC v.0.11.5 (https://www.bioinformatics.babraham.ac.uk/projects/fastqc). No further data filtering or trimming was applied. Raw FASTQ reads, after adapter trimming and quality filtering (reads containing n > 10%, reads where >50% of read has a Q score ≤ 5), were deposited on the Sequence Read Archive (SRA).
Alignment to reference genome and quality control
Paired FASTQ files were aligned to GRCh38 human genome reference using GENCODE v.33 gene annotations and STAR v.2.6.0a splice aware aligner31, using ENCODE recommended options (3.2.2 in the STAR manual (https://github.com/alexdobin/STAR/blob/master/doc/STARmanual.pdf)). The two-pass alignment method was used.
Alignment files were assessed for saturation of known splice junctions using RSeqQC v.3.0.1 (ref. 62).
Transcriptome assembly
Unique transcripts were assembled from merged alignment files, and a merged transcriptome reference formed from the unique transcripts and GENCODE v.33 reference transcriptome using SCALLOP tool v.0.10.5 (ref. 63).
Alignment to reference transcriptome and transcript level abundance estimates
SALMON tool v.1.3.0 (ref. 64) was used to perform transcript abundance estimates from raw FASTQ files, using selective alignment with a decoy-aware transcriptome assembled using the Scallop tool. Integrative genome viewer v.2.3.93 (ref. 65) was used to visualize alignment files.
Differential splicing analysis
A Mendelian RNA-seq method for identifying and filtering splice junctions developed by Cummings et al.30 was used to detect aberrant and new splice events. No changes were made to this code. The individual sample splice junction discovery output files were combined into an overall splice junction discovery file used for splice junction normalization.
RNA extraction and cDNA production
From nasal and bronchial brushings
The cDNA was synthesized from excess RNA purified for RNA-seq using High Capacity cDNA Reverse Transcription kit (Thermo Fisher Scientific) following the manufacturer’s instructions.
From cell lines
RNA was isolated from cell lysates using standard phenol–chloroform extraction, and reverse transcribed to cDNA using a Precision Reverse Transcription kit (PrimerDesign) according to the manufacturer’s instructions. From BCi-NS1.1, RNA was isolated from cell lysates using standard QIAzol extraction, and reverse transcribed to cDNA using a High Capacity cDNA Reverse Transcription kit (Thermo Fisher Scientific) following the manufacturer’s instructions.
Long-range RT–PCR and Sanger sequencing
Phusion High-Fidelity PCR Master Mix with HF Buffer (New England Biolabs) was used to amplify the novel and annotated transcript using custom primers (IDT) from cDNA produced from nasal brushings and BCi-NS1.1 cells. Manufacturer’s instructions and recommended thermocycling conditions were followed, with annealing temperature (64 °C) calculated using NEB Tm calculator. RT–PCR primer sequences can be found in Supplementary Table 1. Samples were size separated against Hyperladder 1 kb (Bioline). Gel-extracted PCR products were sequenced using forward and reverse PCR primers at 3.2 µM by Source Biosciences. Electropherograms were visualized using 4Peaks.
RT–qPCR
The cDNA from cell cultures and from human multiple tissues control cDNA panel I (TakaraBio) was amplified by qPCR (cycling conditions 95 °C for 10 min, then 50 cycles of 95 °C for 15 s and 60 °C for 1 min) using ACE2 primer pairs (Supplementary Table 1). Data were normalized to the geometric mean of the housekeeping genes (ubiquitin C and glyceraldehyde-3-phosphate dehydrogenase, probe-based duplex primer mix, PrimerDesign) and fold-change in gene expression relative to controls was determined using the ΔΔCt method. Probe-based primers were used to determine expression levels of human MX1 (catalog no. DD-hu-600-MX1, PrimerDesign), IP10 (catalog no. PP-hu-900-IP10, PrimerDesign) and IFNB1 (catalog no. DD-hu-600-IFNB1, PrimerDesign) (Supplementary Table 1). To detect SARS-CoV-2 in BCi-NS1.1 cells, Taqman gene expression assays were used against 2019-nCoV_N1 (primer sequences from Public Health Service Centers for Disease Control and Prevention, 20 January 2020 copy) normalized to the genes HPRT, 18S and RNase P expression using the ΔCt method.
Electrophoresis gels
All gels were 1.5% agarose in 1× TAE (Tris base, acetic acid and EDTA) buffer and staining with ethidium bromide (Sigma, 5 µl per 50 ml gel). Gels were run for 75 min at 90 V. PCR products were loaded with 6× purple gel loading dye (catalog no. B7025, New England Biolabs) and electrophoresed alongside a low-molecular-mass ladder (range 25–766 bp, catalog no. N3233, New England Biolabs) or HyperLadder 1 kb (range 200 bp to 10 kb, catalog no. BIO-33053, Bioline) to determine product sizes.
Cilia extraction
Cilia were extracted from differentiated ALI cultures on 24 Transwell inserts (Costar) following a protocol-modified from Ostrowski et al.66. Cells on ice were washed with ice-cold phosphate-buffered saline (PBS), then incubated on the apical surface for 15 min in 100-µl washes with deciliation buffer (20 mM Tris hydrochloride, pH 7.5, 0.05 M sodium chloride, 10 mM calcium chloride, 1 mM EDTA, 7 mM 2-mercaptoethanol and 0.1% Triton X-100)67 containing additional protease inhibitor cocktail (Sigma) 10 μl ml−1 of buffer. Washes were pooled and centrifuged for 2 min at 1,000g to pellet. Supernatant fractions were centrifuged at 16,000g for 8 min. Cilia pellets were frozen before the western blot procedure. Immunofluorescence labeling confirmed cilia enrichment and detachment of cilia on ALI membranes. Briefly, ice-cold methanol-fixed and 4% dried-milk-blocked cilia pellets and deciliated cell membranes (excised from Transwell inserts) were labeled for 1 h at room temperature with a mouse anti-α-tubulin antibody (catalog no. T9026, Sigma) diluted 1:500 in PBS–Tween (PBST). After three PBST washes a secondary goat anti-mouse Alexa Fluor 488 antibody (Molecular Probes) was incubated for 30 min at room temperature before PBST washes. Deciliated cells on membranes were additionally DAPI stained before mounting. Cilia pellets and membranes were mounted in Mowiol between two glass coverslips and imaged using a Leica SP8 laser scanning confocal microscope and LAS X software.
Western blot
Cells were washed in PBS or HBSS and lysed in 20 mM Tris-HCl, pH 8.0, 137 mM NaCl, 1% (w:v) NP-40, 2 mM EDTA supplemented with cOmplete protease inhibitor (Sigma). Samples were diluted with 10× denaturing buffer (5% sodium dodecylsulfate (SDS), 400 mM dithiothreitol) and 6× nonreducing SDS sample buffer (Boston BioProducts), incubated at 60 °C for 10 min and separated on an SDS–poyacylamide gel electrophoresis (PAGE) gel and transferred to poly(vinylidene fluoride) membranes (BioRad). After blocking in 5% milk/Tris-buffered saline–Tween 20 membranes were probed with primary anti-ACE2 antibody (Abcam, catalog no. 15348 for total ACE2 or Novus no. NBP2-67692 for long ACE2), followed by the appropriate secondary horseradish peroxidase-conjugated antibody (Dako). Bound antibody was detected using Clarity ECL Western Blotting Substrate (BioRad) with the image digitally captured using an Amersham Imager 600 (GE Healthcare Life Sciences). Horseradish peroxidase-conjugated, anti-β-actin antibody (Sigma) was used as a loading control. ImageJ was used for densitometry.
Peptide-blocking assay
A 1:500 dilution of antibody ab15348 was incubated with 10 μg ml−1 of immunizing peptide (CKGENNPGFQNTDDVQTSF) or a control peptide (GMEHLREVRAVTSANIQEF) for 2 h at room temperature with agitation, before incubating the blots at 4 °C overnight under rotation.
PNGase F treatment
PNGase F (New England Biolabs) was used to remove N-linked oligosaccharides from glycoproteins following the manufacturer’s instructions.
Immunofluorescence cell staining
After an apical wash with HBSS, cells were fixed with 4% paraformaldehyde, permeabilized with 0.1% Triton X-100 and blocked with 1% bovine serum albumin in PBS. Membranes were cut from the inserts and epithelial cells were stained with anti-ACE2 antibodies (ab15348 (Abcam), AF933 (R&D Systems) and NBP2-67692 (Novus)), anti-α-tubulin (T9026, Sigma) and appropriate fluorescently labeled secondary antibodies (Alexa Fluor 488-labeled anti-mouse (Invitrogen), Alexa Fluor 649-labeled anti-goat (Abcam) and DyLight 647-labeled anti-rabbit (Biolegend)). Actin filaments were stained using Alexa Fluor 555 phalloidin (Cytoskeleton Inc.) and nuclei with DAPI. Confocal images were taken using a Leica SP8 laser scanning confocal microscope with LAS X software.
Antibodies
See Supplementary Table 2.
Human RV16 propagation and titration
Human RV (HRV16; ATCC VR-283) was amplified using H1 HeLa cells as previously described68,69. Infectivity of stocks and release of infective virions in cell culture supernatants was determined using a HeLa titration assay and 50% tissue culture infective dose assay (TCID50 ml−1). Ultraviolet-irradiated virus controls (UV-RV16) were prepared by exposure of virus stocks to UV light at 1,200 mJ cm−2 on ice for 50 min.
RV infection of differentiated human NECs and bronchial epithelial cells
Fully differentiated NECs and bronchial epithelial cells (28 or 21 d after ALI) were apically infected with HRV16 at a multiplicity of Infection of 1 for 6 h, washed apically three times with HBSS and incubated for an additional 18 h at the ALI (24 h in total). Cells were washed three times with HBSS and lysed using TRIzol (Invitrogen) for RNA and protein extraction.
SARS-CoV-2 infection
BCi-NS1.1 cells (42–63 d after ALI) were apically infected for 1 h with 100,000 plaque-forming units of SARS-CoV-2 strain BetaCoV/Australia/VIC01/2020 (obtained from Public Health England and propagated in Vero E6 cells for no more than two passages before use) and washed twice using HBSS. Cells were harvested into QIAzol (QIAGEN) at 1 h after the HBSS wash and at 72 h post-infection for RNA extraction.
Interferon treatment
PBEC monolayer cultures were stimulated with 100 IU ml−1 or 1,000 IU ml−1 of recombinant human IFN-α A (α 2a) protein (R&D, catalog no. 11100-1), IFN-β (a gift from Synairgen Research), IFN-γ (Peprotech, catalog no. 300-02) or IFN-λ (National institute of Biological standards and Control (NIBSC), catalog no. 10-176) at a confluency of 70%, and differentiated PBEC cultures at ALI were stimulated basolaterally with 1,000 IU ml−1 of IFN-β. After 24 h RNA was isolated using Monarch Total RNA miniprep Kit (New England Biolabs) and reverse transcribed to cDNA using a Precision Reverse Transcription kit (PrimerDesign) according to the manufacturer’s instructions.
Exogenous protein expression cloning
Full-length sequence-verified human ACE2 cDNA expression clone with C-terminal GFP tag was purchased from Origene (catalog no. rg208442). Nucleotides encoding amino acids 1–356 were removed from the vector by BamHI (New England Biolabs) digestion and cut ends dephosphorylated using rSAP (New England Biolabs). The cut vector was isolated using 0.5% agarose gel electrophoresis and band extraction using QIAquick Gel Extraction Kit (QIAGEN). BamHI digestion also removes the ribosome-binding site and Kozak consensus sequence. The ribosome-binding site, Kozak consensus sequence and nucleotides encoding 10 new amino acids were inserted into the vector using a phosphorylated Ultramer Duplex with BamHI overhangs (IDT) (Supplementary Table 3).
Insert and digested vector were ligated using T4 DNA ligase (New England Biolabs), transformed into competent Escherichia coli (Agilent) and multiple colonies picked from ampicillin lysogeny broth agar plates for sequence verification, using T7 promoter forward sequencing primer. Sequencing was performed by Source Biosciences. Clones with the insert in the correct orientation were selected for amplification in E. coli in liquid lysogeny broth medium and purification using plasmid midi-kit (QIAGEN).
Transfection
H441 and Vero E6 cells were transfected with short-ACE2-turboGFP, long-ACE2-turboGFP or control GFP constructs using Lipofectamine 3000 (Thermo Fischer Scientific) following the manufacturer’s protocol. HEK293 cells were transfected with polyethyleneimine, and RPE1 cells were nucleofected using a Lonza nucleofector 4D, and program EA104. All cells were imaged live after 24 h.
Cell-free expression
The sequences encoding the ectodomains (10–740) of wild-type and short ACE2 isoforms were cloned into pTXTL_p70a vectors containing C-terminal His 6 and GFP11 sequences. To generate the linear DNA used for cell-free expression, the plasmids were amplified with primers generating an extra 500 bp of flanking regions (Supplementary Table 1). The cell-free protein expression was performed in a 24-µl scale using the MyTXTL Linear DNA Expression kit (Arbor Bioscience) with 5 nM DNA for 4 h at 29 °C. After expression, a sample was taken for gel analysis, the remaining cell lysate was spun down and the pellet was resuspended in reducing loading dye. The total and pellet samples were run on a reducing 4–20% SDS–PAGE gel (BioRad) and stained with InstantBlue Coomassie Protein Stain (Abcam).
Structural analysis
PyMOL Molecular Graphics System, v.2.0 (Schrödinger, LLC) or UCSF Chimera70 was used to model the novel protein isoform based on full-length isoform 6M17. Molecular dynamic simulation was performed by preparing an initial three-dimensional model of the new protein isoform based on PDB entry 6M17 using the homology modeling function of YASARA71. Molecular dynamics simulations in explicit solvent were performed using YASARA with GPU acceleration72 on an Intel i9-9940X CPU (using 28 threads) and GeForce RTX 2080 Ti. The molecular trajectory was sampled for 320 ns under isothermal-isobaric ensemble conditions at 310 K in 0.1% NaCl solution at pH 7.4 using periodic boundary conditions. PyMOL, Chimera70 and VMD73 were used for molecular display and animation.
Statistics
Statistical analyses were performed in GraphPad Prism v.7.02 (GraphPad Software Inc.) unless otherwise indicated. For each experiment, sample size reflects the number of independent experimental replicates and is provided in the figure legend. The normality of data was assessed using Shapiro’s test to inform whether to apply parametric or nonparametric statistical tests. Statistical analyses of single comparisons of two groups utilized Student’s t-test or Wilcoxon’s signed rank test for parametric and nonparametric data, respectively. Correlations between groups of data were analyzed using Pearson’s or Spearman’s rank correlation coefficients for parametric and nonparametric data, respectively. Results were considered significant if P ≤ 0.05, where *P ≤ 0.05, **P ≤ 0.01, ***P ≤ 0.001 and ****P ≤ 0.0001.
Reporting Summary
Further information on research design is available in the Nature Research Reporting Summary linked to this article.
Data availability
The RNA-seq datasets analyzed during the current study (Figs. 1 and 2, and Extended Data Figs. 2 and 6) are available in the SRA repository, accession no. PRJNA650028 (Figs. 1 and 2, and Extended Data Fig. 2) and accession no. PRJNA674784 (Extended Data Fig. 6). The ACE2 protein structure from the 2019-nCoV RBD/ACE2-B0AT1 complex is available from RSCB PDB, structure PDB 6M17. Source data are provided with this paper.
References
Li, W. et al. Angiotensin-converting enzyme 2 is a functional receptor for the SARS coronavirus. Nature 426, 450–454 (2003).
Matsuyama, S. et al. Efficient activation of the severe acute respiratory syndrome coronavirus spike protein by the transmembrane protease TMPRSS2. J. Virol. 84, 12658 (2010).
Kuba, K. et al. A crucial role of angiotensin converting enzyme 2 (ACE2) in SARS coronavirus-induced lung injury. Nat. Med. 11, 875–879 (2005).
Yan, R. et al. Structural basis for the recognition of SARS-CoV-2 by full-length human ACE2. Science 367, 1444–1448 (2020).
Wrapp, D. et al. Cryo-EM structure of the 2019-nCoV spike in the prefusion conformation. Science 367, 1260–1263 (2020).
Hoffmann, M. et al. SARS-CoV-2 cell entry depends on ACE2 and TMPRSS2 and Is blocked by a clinically proven protease inhibitor. Cell 181, 271–280.e8 (2020).
Blau, D. M. & Holmes, K. V. Human coronavirus HCoV-229E enters susceptible cells via the endocytic pathway. Adv. Exp. Med Biol. 494, 193–198 (2001).
Inoue, Y. et al. Clathrin-dependent entry of severe acute respiratory syndrome coronavirus into target cells expressing ACE2 with the cytoplasmic tail deleted. J. Virol. 81, 8722–8729 (2007).
Wang, H. et al. SARS coronavirus entry into host cells through a novel clathrin- and caveolae-independent endocytic pathway. Cell Res. 18, 290–301 (2008).
Donoghue, M. et al. A novel angiotensin-converting enzyme-related carboxypeptidase (ACE2) converts angiotensin I to angiotensin 1–9. Circ. Res. 87, E1–E9 (2000).
Tipnis, S. R. et al. A human homolog of angiotensin-converting enzyme. Cloning and functional expression as a captopril-insensitive carboxypeptidase. J. Biol. Chem. 275, 33238–33243 (2000).
Camargo, S. M. et al. Tissue-specific amino acid transporter partners ACE2 and collectrin differentially interact with Hartnup mutations. Gastroenterology 136, 872–882 (2009).
Kowalczuk, S. et al. A protein complex in the brush-border membrane explains a Hartnup disorder allele. FASEB J. 22, 2880–2887 (2008).
Niu, M.-J., Yang, J.-K., Lin, S.-S., Ji, X.-J. & Guo, L.-M. Loss of angiotensin-converting enzyme 2 leads to impaired glucose homeostasis in mice. Endocrine 34, 56–61 (2008).
Bindom, S. M., Hans, C. P., Xia, H., Boulares, A. H. & Lazartigues, E. Angiotensin I-converting enzyme type 2 (ACE2) gene therapy improves glycemic control in diabetic mice. Diabetes 59, 2540–2548 (2010).
Imai, Y. et al. Angiotensin-converting enzyme 2 protects from severe acute lung failure. Nature 436, 112–116 (2005).
Treml, B. et al. Recombinant angiotensin-converting enzyme 2 improves pulmonary blood flow and oxygenation in lipopolysaccharide-induced lung injury in piglets. Crit. Care Med. 38, 596–601 (2010).
Ferreira, A. J. et al. Evidence for angiotensin-converting enzyme 2 as a therapeutic target for the prevention of pulmonary hypertension. Am. J. Respir. Crit. Care Med. 179, 1048–1054 (2009).
Yamazato, Y. et al. Prevention of pulmonary hypertension by angiotensin-converting enzyme 2 gene transfer. Hypertension 54, 365–371 (2009).
Pedersen, K. B., Chhabra, K. H., Nguyen, V. K., Xia, H. & Lazartigues, E. The transcription factor HNF1α induces expression of angiotensin-converting enzyme 2 (ACE2) in pancreatic islets from evolutionarily conserved promoter motifs. Biochim. Biophys. Acta 1829, 1225–1235 (2013).
Kuan, T. C. et al. Identifying the regulatory element for human angiotensin-converting enzyme 2 (ACE2) expression in human cardiofibroblasts. Peptides 32, 1832–1839 (2011).
Wang, Y. et al. Administration of 17β-estradiol to ovariectomized obese female mice reverses obesity-hypertension through an ACE2-dependent mechanism. Am. J. Physiol. Endocrinol. Metab. 308, E1066–E1075 (2015).
Ziegler, C. G. K. et al. SARS-CoV-2 receptor ACE2 is an interferon-stimulated gene in human airway epithelial cells and is detected in specific cell subsets across tissues. Cell 181, 1016–1035.e19 (2020).
Lonsdale, J. et al. The Genotype-Tissue Expression (GTEx) project. Nat. Genet. 45, 580–585 (2013).
Sungnak, W. et al. SARS-CoV-2 entry factors are highly expressed in nasal epithelial cells together with innate immune genes. Nat. Med. 26, 681–687 (2020).
Hou, Y. J. et al. SARS-CoV-2 reverse genetics reveals a variable infection gradient in the respiratory tract. Cell 182, 429–446.e14 (2020).
Zou, L. et al. SARS-CoV-2 viral load in upper respiratory specimens of infected patients. N. Engl. J. Med. 382, 1177–1179 (2020).
Sims, A. C. et al. Severe acute respiratory syndrome coronavirus infection of human ciliated airway epithelia: role of ciliated cells in viral spread in the conducting airways of the lungs. J. Virol. 79, 15511–15524 (2005).
Schaefer, I.-M. et al. In situ detection of SARS-CoV-2 in lungs and airways of patients with COVID-19. Mod. Pathol. 33, 2104–2114 (2020).
Cummings, B. B. et al. Improving genetic diagnosis in Mendelian disease with transcriptome sequencing. Sci. Transl. Med. 9(386), eaal5209 (2017).
Dobin, A. et al. STAR: ultrafast universal RNA-seq aligner. Bioinformatics 29, 15–21 (2013).
Fu, X. Y., Kessler, D. S., Veals, S. A., Levy, D. E. & Darnell, J. E. Jr. ISGF3, the transcriptional activator induced by interferon alpha, consists of multiple interacting polypeptide chains. Proc. Natl Acad. Sci. USA 87, 8555–8559 (1990).
Isern, E. et al. The activator protein 1 binding motifs within the human cytomegalovirus major immediate-early enhancer are functionally redundant and act in a cooperative manner with the NF-κB sites during acute infection. J. Virol. 85, 1732–1746 (2011).
Wan, F. & Lenardo, M. J. Specification of DNA binding activity of NF-kappaB proteins. Cold Spring Harb. Perspect. Biol. 1, a000067–a000067 (2009).
Walters, M. S. et al. Generation of a human airway epithelium derived basal cell line with multipotent differentiation capacity. Respir. Res. 14, 135–135 (2013).
Jia, H. P. et al. ACE2 receptor expression and severe acute respiratory syndrome coronavirus infection depend on differentiation of human airway epithelia. J. Virol. 79, 14614–14621 (2005).
Drosten, C. et al. Identification of a novel coronavirus in patients with severe acute respiratory syndrome. N. Engl. J. Med. 348, 1967–1976 (2003).
Matsuyama, S. et al. Enhanced isolation of SARS-CoV-2 by TMPRSS2-expressing cells. Proc. Natl Acad. Sci. USA 117, 7001–7003 (2020).
Lee, I. T. et al. ACE2 localizes to the respiratory cilia and is not increased by ACE inhibitors or ARBs. Nat. Commun. 11, 5453 (2020).
Kindler, E., Thiel, V. & Weber, F. Interaction of SARS and MERS coronaviruses with the antiviral interferon response. Adv. Virus Res. 96, 219–243 (2016).
Yuen, C. K. et al. SARS-CoV-2 nsp13, nsp14, nsp15 and orf6 function as potent interferon antagonists. Emerg. Microbes Infect. 9, 1418–1428 (2020).
Busnadiego, I. et al. Antiviral activity of type I, II, and III interferons counterbalances ACE2 inducibility and restricts SARS-CoV-2. mBio 11, e01928–20 (2020).
Acharya, D., Liu, G. & Gack, M. U. Dysregulation of type I interferon responses in COVID-19. Nat. Rev. Immunol. 20, 397–398 (2020).
Contoli, M. et al. Role of deficient type III interferon-lambda production in asthma exacerbations. Nat. Med. 12, 1023–1026 (2006).
Wark, P. A. et al. Asthmatic bronchial epithelial cells have a deficient innate immune response to infection with rhinovirus. J. Exp. Med. 201, 937–947 (2005).
Camiolo, M., Gauthier, M., Kaminski, N., Ray, A. & Wenzel, S. E. Expression of SARS-CoV-2 receptor ACE2 and coincident host response signature varies by asthma inflammatory phenotype. J. Allergy Clin. Immunol. 146, 315–324.e7 (2020).
Ng, K. W. et al. Tissue-specific and interferon-inducible expression of nonfunctional ACE2 through endogenous retroelement co-option. Nat. Genet. 52, 1294–1302 (2020).
Onabajo, O. O. et al. Interferons and viruses induce a novel truncated ACE2 isoform and not the full-length SARS-CoV-2 receptor. Nat. Genet. 52, 1–11 (2020).
Clarke, N. E., Belyaev, N. D., Lambert, D. W. & Turner, A. J. Epigenetic regulation of angiotensin-converting enzyme 2 (ACE2) by SIRT1 under conditions of cell energy stress. Clin. Sci. 126, 507–516 (2014).
Monk, P. D. et al. Safety and efficacy of inhaled nebulised interferon beta-1a (SNG001) for treatment of SARS-CoV-2 infection: a randomised, double-blind, placebo-controlled, phase 2 trial. Lancet Respir. Med. https://doi.org/10.1016/S2213-2600(20)30511-7 (2020).
Garcia-Pachon, E. et al. Asthma prevalence in patients with SARS-CoV-2 infection detected by RT-PCR not requiring hospitalization. Respir. Med 171, 106084 (2020).
Grandbastien, M. et al. SARS-CoV-2 pneumonia in hospitalized asthmatic patients did not induce severe exacerbation. J. Allergy Clin. Immunol. Pract. 8, 2600–2607 (2020).
Chhiba, K. D. et al. Prevalence and characterization of asthma in hospitalized and nonhospitalized patients with COVID-19. J. Allergy Clin. Immunol. 146, 307–314.e4 (2020).
Ho, M. Perspectives on the development of neutralizing antibodies against SARS-CoV-2. Antib. Ther. 3, 109–114 (2020).
Inal, J. M. Decoy ACE2-expressing extracellular vesicles that competitively bind SARS-CoV-2 as a possible COVID-19 therapy. Clin. Sci. 134, 1301–1304 (2020).
Saheb Sharif-Askari, N. et al. Airways expression of SARS-CoV-2 receptor, ACE2, and TMPRSS2 is lower in children than adults and increases with smoking and COPD. Mol. Ther. Methods Clin. Dev. 18, 1–6 (2020).
Pinto, B. G. G. et al. ACE2 expression is increased in the lungs of patients with comorbidities associated with severe COVID-19. J. Infect. Dis. 222, 556–563 (2020).
Emilsson, V. et al. ACE2 levels are altered in comorbidities linked to severe outcome in COVID-19. Preprint at medRxiv https://doi.org/10.1101/2020.06.04.20122044 (2020).
Hirst, R. A. et al. Culture of primary ciliary dyskinesia epithelial cells at air–liquid interface can alter ciliary phenotype but remains a robust and informative diagnostic aid. PLoS ONE 9, e89675 (2014).
Xiao, C. et al. Defective epithelial barrier function in asthma. J. Allergy Clin. Immunol. 128, 549–56.e1-12 (2011).
Kuek, L. E. et al. Identification of an immortalized human airway epithelial cell line with dyskinetic cilia. Am. J. Respir. Cell Mol. Biol. 59, 375–382 (2018).
Wang, L., Wang, S. & Li, W. RSeQC: quality control of RNA-seq experiments. Bioinformatics 28, 2184–2185 (2012).
Shao, M. & Kingsford, C. Accurate assembly of transcripts through phase-preserving graph decomposition. Nat. Biotechnol. 35, 1167–1169 (2017).
Patro, R., Duggal, G., Love, M. I., Irizarry, R. A. & Kingsford, C. Salmon provides fast and bias-aware quantification of transcript expression. Nat. Methods 14, 417–419 (2017).
Robinson, J. T. et al. Integrative genomics viewer. Nat. Biotechnol. 29, 24–26 (2011).
Ostrowski, L. E. et al. A proteomic analysis of human cilia. Mol. Cell. Proteom. 1, 451–465 (2002).
Hastie, A. T. et al. Isolation of cilia from porcine tracheal epithelium and extraction of dynein arms. Cell Motil. Cytoskeleton 6, 25–34 (1986).
Calvén, J. et al. Viral stimuli trigger exaggerated thymic stromal lymphopoietin expression by chronic obstructive pulmonary disease epithelium: role of endosomal TLR3 and cytosolic RIG-I-like helicases. J. Innate Immun. 4, 86–99 (2012).
Zhao, W. et al. Peroxisome proliferator-activated receptor gamma negatively regulates IFN-beta production in Toll-like receptor (TLR) 3- and TLR4-stimulated macrophages by preventing interferon regulatory factor 3 binding to the IFN-beta promoter. J. Biol. Chem. 286, 5519–5528 (2011).
Pettersen, E. F. et al. UCSF Chimera—a visualization system for exploratory research and analysis. J. Comput. Chem. 25, 1605–1612 (2004).
Krieger, E. et al. Improving physical realism, stereochemistry, and side-chain accuracy in homology modeling: four approaches that performed well in CASP8. Proteins 77, 114–122 (2009).
Krieger, E. & Vriend, G. New ways to boost molecular dynamics simulations. J. Comput. Chem. 36, 996–1007 (2015).
Humphrey, W., Dalke, A. & Schulten, K. VMD: visual molecular dynamics. J. Mol. Graph 14, 33–38 (1996).
Acknowledgements
Research was funded by Asthma, Allergy and Inflammation Research (AAIR) Charity (grant no. AAIR/01/ACE2/2020) and supported by National Institute for Health Research (NIHR) Southampton Biomedical Research Centre (BRC) and NIHR Wellcome Trust Clinical Research Facility. Research development was partly supported by AAIR (grant no. AAIR/hybrid_cilia/2020). G.W. was supported by a Wellcome Trust Seed Award in Science (no. 204378/Z/16/Z). D.B. was supported by NIHR Research Professorship (no. RP-2016-07-011). J.S.L., C.L.J., V.M., J.T. and J.C. were supported by the NHS England PCD National Service. C.B. is a University of Southampton Career Track Fellow and F.C. is a Medical Research Foundation Fellow. M.L. is a BBSRC Future Leader Fellow (BB/P011365/1) and an NIHR Southampton BRC Senior Research Fellow. F.C. was supported by a Medical Research Foundation grant (no. MRF-091-0003-RG-CONFO). J.M.P. thanks the European Respiratory Society (Fellowship LTRF 2017) for their support and received an AAIR Charity Research Grant 2019. L.S.N.D. was supported by funding from the NIHR Southampton BRC. We thank healthy volunteers and respiratory patients who donated airway cells and Synairgen Research Ltd which provided cells and reagents to support these studies.
Author information
Authors and Affiliations
Contributions
V.M. and J.S.L. conceptualized and supervised the initial study to interrogate RNA-seq data for ACE2 isoforms. G.W. and J.L. conducted the RNA-seq analyses. G.W. identified the new transcript, from which point C.B., C.L.J., D.E.D., J.S.L., G.W. and V.M. conceptualized and supervised the remainder of the study. C.L.J., C.B., G.W., D.E.D. and V.M. designed the experiments and analyzed data. C.L.J. and C.B. performed most of the experimental work with additional contributions from G.W., C.M.S, L.N., J.B., F.C., J.C., J.T., D.A.J., C.J.McC., R.A.R., L.S.N.D., P.J.S., S.R. and M.L. G.W., C.B., J.S.L., V.M., D.B., D.E.D., R.D., J.M.P., A.A., P.J.S. and K.T. provided samples and/or resources. M.F. and M.C. developed predictive structural models. G.W., V.M. and D.E.D. wrote the manuscript with C.B., C.L.J. and J.S.L. V.M. and G.W. prepared figures with C.B., C.L.J., D.E.D. and D.A.J.. All authors approved the final submission.
Corresponding authors
Ethics declarations
Competing interests
D.E.D. and R.D. are co-founders, shareholders and consultants to the university spin-off company, Synairgen, which is developing inhaled IFN-β for treatment of respiratory viral infections, including SARS-CoV2 (COVID-19). S.R. is an employee of, and shareholder in, Nuclera Nucleic Acids Ltd. Other authors declare no competing interests.
Additional information
Peer review information Peer reviewer reports are available.
Publisher’s note Springer Nature remains neutral with regard to jurisdictional claims in published maps and institutional affiliations.
Extended data
Extended Data Fig. 1
a, Plots of CT value against cDNA input into RT-qPCR reactions to determine dynamic range of RT-qPCRs for 3 SyBr green assays using primers targeting total ACE2 (top left), long ACE2 (top right) and short ACE2 (bottom left) and one probe-based Taqman assay using primers targeting short ACE2. CT values below the indicated dotted line were regarded as positive results. b, Box and whisker plots showing 5-95 percentile, median and individual data points of relative expression (2-ddCT) of short ACE2 in untreated nasal ALI cultures and those infected with RV-16, UV-RV16, assayed using SyBr green qPCR assay compared to probe-based Taqman assay to show consistency of short ACE2 qPCR assays. Shapiro Wilk test of normality failed, so non-parametric Wilcoxon test used, two-tailed, comparing RV16 to UV-RV16, n = 11 different donors of nasal brushings. p = 0.001.
Extended Data Fig. 2
Boxplot and whisker showing median, quartiles and range of gene expression data (in transcripts per million, TPM) for 6 selected cilia genes from RNAseq data from primary nasal brushings (blue) and primary nasal epithelial cells cultured at ALI for 1, 4, 8, 14, 21, 28 and 63 days (orange), to demonstrate early activation of genes associated with ciliogenesis and cilium function from day 4. n = 3 different donors for primary nasal brushings and at each time point at ALI.
Extended Data Fig. 3
a, Graphical representation of long and short ACE2 protein with position of relevant spike binding regions and protease cleavage domains. TM = transmembrane domain, CYT = cytoplasmic domain. b, Long ACE2 homodimer (teal) in complex with SARS-Cov-2 spike protein (orange) (right) from cryo-EM resolved structure PDB 6M17; predicted short ACE2 homodimer (right) based on this structure. In both, residues essential for cleavage by ADAM17 are shown in yellow and residues essential for cleavage by TMPRSS11D and TMPRSS2 are shown in fuchsia. The residues present in long ACE2 but absent in short ACE2 are shown in royal blue on the long ACE2 structure. c, High magnification of the putative interaction region of long ACE2 with SARS-CoV-2 spike protein (top) and the same region in short ACE2 (bottom). d, Snapshot of MD simulation of short ACE2 obtained with YASARA (Supplementary Video 1) e, DSSP analysis of short ACE2 chain A and B over the course of the 300 ns MD simulation. f, Analysis of helical content (left) and secondary structure variation (right) of short ACE2 over the course of the 300 ns MD simulation.
Extended Data Fig. 4 Representative IF confocal images of ALI-differentiated primary bronchial epithelial cells stained with 2 commercial anti ACE 2antibodies (green), anti-alpha-tubulin (red), Actin-stain 555 phalloidin (blue) and DAPI (grey).
Overlay and separate channels. a, XY imaging plane and XZ and YZ orthogonal confocal slices along white lines using ACE2 C-terminal domain antibody (anti-ACE2 CTD). Scale bar = 20 µm. b, XY imaging plane and XZ and YZ orthogonal confocal slices along white lines using ACE2 ectodomain antibody (anti-ACE2 ECTO). Scale bar = 20 µm. c, Enlarged orthogonal slices using anti-ACE2 CTD showing ACE2 staining along the ciliary axoneme. Overlay and separate channels. Scale bar = 10 µm. d, Enlarged orthogonal slices using anti-ACE2 ECTO showing ACE2 staining along the ciliary axoneme. Overlay and separate channels. Scale bar = 10 µm.
Extended Data Fig. 5
a, Coomassie stained polyacrylamide gel showing purification of short (left) and long (right) ACE2 ectodomains from an E. coli cell-free system. Tot = total lysate loading, P = purified protein. Black arrows point to purified proteins at expected sizes. b, Wide field epifluorescence and phase contrast image overlay of H441 cells transfected with exogenous long ACE2-turboGFP (left) or exogenous short ACE2-turboGFP (right). Scale bar = 50 μM. White arrows point to membrane localization of long ACE2-turboGFP.
Extended Data Fig. 6
a, b, Box (median and quartiles) and whisker (5-95 percentile) plots plus individual data points of relative expression (2-ddCT) of MX1 (a) and IP10 (b) in undifferentiated primary bronchial epithelial cells (PBECs) treated with IFN-α (n = 3 donors), IFN-β (n = 7 donors), IFN-γ (n = 4 donors) or IFN-λ (n = 4 donors) for 24 h at indicated doses. Data were analysed using a two-tailed Mann-Whitney test, compared to control. MX1: IFN-α 100 p = 0.0083; IFN-α 1000 p = 0.0083; IFN-β 100 p = 0.0006; IFN-β 1000 p = 0.0006; IFN-γ 100 p = 0.030; IFN-γ 1000 p = 0.0030; IFN-λ 100 p = 0.0030. IP10: IFN-α 100 p = 0.0083; IFN-α 1000 p = 0.0083; IFN-β 100 p = 0.0006; IFN-β 1000 p = 0.0006; IFN-γ 100 p = 0.0030; IFN-γ 1000 p = 0.0030; IFN-λ 100 p = 0.0030. c, d, Box (median and quartiles) and whisker (5-95 percentile) plots plus individual data points of relative expression (2-ddCT) of long ACE2 (c) and ratio of short to long ACE2 expression (Δshort-long -dCT) (d) in undifferentiated primary bronchial epithelial cells (PBECs) treated with IFN-α (n = 3 donors), IFN-β (n = 7 donors), IFN-γ (n = 4 donors) or IFN-λ (n = 4 donors) for 24 h at indicated doses. Data were analysed using a two-tailed Mann-Whitney test, compared to control. Long ACE2: IFN-α 100 p = 0.0083; IFN-α 1000 p = 0.0083; IFN-γ 1000 p = 0.0030; IFN-λ 100 p = 0.0030. Δshort-long -dCT: IFN-β 100 p = 0.0313; IFN-β 1000 p = 0.0313. e, f, Dot plots showing individual data points, median and 5-95 percentile of relative expression (2-ddCT) of total ACE2, long ACE2 and short ACE2 (e) and MX1 and IP10 (f) in in vitro differentiated (ALI) PBEC cultures (N = 3 donors) treated with IFN-β (1000 IU/ml). Data were analysed using two tailed paired Students t-test. g, h, Dot plots showing individual data points, median and 5-95 percentile of relative expression (2-ddCT) of total ACE2, long ACE2 and short ACE2 (g) and MX1 and IP10 (h) in in BCi-NS1.1 cells infected with RV16 (n = 3 replicates, same passage number on same day).
Extended Data Fig. 7
a-d, g, Box (median and quartiles) and whisker (5-95 percentile) plots plus individual data points. a-e, In vitro differentiated primary bronchial epithelia cells (PBECs) infected with rhinovirus (RV16) or UV-irradiated control (UV-RV16) for 24 hours. a-b, Relative expression (2-ddCT) of total, long and short ACE2 in PBECs from healthy (a) (n = 13) or severe asthmatic (b) (n = 12) donors. Two-tailed Wilcoxon test UV-RV16 vs RV16. Healthy (a): total ACE2 p = 0.0010; short ACE2 p = 0.0007. Severe asthma (b) total ACE2 p = 0.0020; short ACE2 p = 0.0010. c, Ratio of short to long ACE2 expression (Δshort-long -dCT). Two-tailed Mann-Whitney test, healthy vs severe asthma UV-RV16 p = 0.0433; RV16 p = 0.0205. d, Basolateral secretion of IL29/IL28 (pg/ml) determined by ELISA from healthy (n = 14) or severe asthmatic (n = 8) donors. Unpaired two-tailed Student’s t-test, t = 2.154, df=19. Healthy vs severe asthma after RV16 infection p = 0.0433. e, Correlation of short (left) and long ACE2 (right) relative transcript expression (2-ddCT) with secreted IL29/IL28 (pg/ml) (measured by ELISA) from healthy (n = 7) or severe asthmatic (n = 5) donors Spearman’s rank correlation. f, Dot plot showing baseline expression (-dCT) of total, long and short ACE2 in bronchial epithelial brushes from healthy (n = 13) or severe asthmatic (n = 12) donors. Two-Way ANOVA, Sidak’s multiple comparisons test, F = 2.856, DF = 65.00. Total ACE2 p = 0.0013; long ACE2 p = 0.0034. g, Ratio of short to long ACE2 expression (Δshort-long -dCT) in bronchial epithelial brushes from healthy (n = 13) or severe asthmatic (n = 11) donors. Two-tailed Mann-Whitney test, healthy vs severe asthma p = 0.0474. h, Expression levels of OAS1 and ISG1 (transcripts per million (TPM) in RNAseq data) in bronchial brushings from healthy (n = 13) and severe asthmatic subjects (n = 10) Unpaired two-tailed Student’s t-test, t = 2.648, df=21, p = 0.0150. i, Correlation of short ACE2 (TPM in RNAseq data) in bronchial brushings with IFN-γ levels (pg/ml) in bronchoalveolar lavage (BAL) fluid harvested at the time of bronchoscopy. Spearman’s rank correlation r = 0.4966 p = 0.0220.
Supplementary information
Supplementary Information
Supplementary Information, Note and Tables 1–3
Supplementary Video 1
Video of molecular dynamic simulation of a short ACE2 homodimer.
Source data
Source Data Fig. 1
Unprocessed gel..
Source Data Fig. 2
Unprocessed gels
Source Data Fig. 3
Unprocessed western blots.
Source Data Extended Data Fig. 5
Unprocessed protein gel.
Rights and permissions
About this article

Cite this article
Blume, C., Jackson, C.L., Spalluto, C.M. et al. A novel ACE2 isoform is expressed in human respiratory epithelia and is upregulated in response to interferons and RNA respiratory virus infection. Nat Genet 53, 205–214 (2021). https://doi.org/10.1038/s41588-020-00759-x
Received:
Accepted:
Published:
Issue Date:
DOI: https://doi.org/10.1038/s41588-020-00759-x
This article is cited by
-
Smoking increases expression of the SARS-CoV-2 spike protein-binding long ACE2 isoform in bronchial epithelium
Respiratory Research (2023)
-
ACE2 in chronic disease and COVID-19: gene regulation and post-translational modification
Journal of Biomedical Science (2023)
-
SARS-CoV-2 infection aggravates cigarette smoke-exposed cell damage in primary human airway epithelia
Virology Journal (2023)
-
Association between soluble angiotensin-converting enzyme 2 in saliva and SARS-CoV-2 infection: a cross-sectional study
Scientific Reports (2023)
-
Impact of BSG/CD147 gene expression on diagnostic, prognostic and therapeutic strategies towards malignant cancers and possible susceptibility to SARS-CoV-2
Molecular Biology Reports (2023)
