
Abstract
It is unclear whether associations between total cholesterol (TC) levels and all-cause mortality and the optimal TC ranges for lowest mortality vary by sex and age. 12,815,006 Korean adults underwent routine health examinations during 2001–2004, and were followed until 2013. During follow-up, 694,423 individuals died. U-curve associations were found. In the TC ranges of 50–199 and 200–449 mg/dL, each 39 mg/dL (1 mmol/L) increase in TC was associated with 23% lower (95% CI:23%,24%) and 7% higher (6%,7%) mortality, respectively. In the age groups of 18–34, 35–44, 45–54, 55–64, 65–74, and 75–99 years, each 1 mmol/L higher TC increased mortality by 14%, 13%, 8%, 7%, 6%, and 3%, respectively (P < 0.001 for each age group), for TC ≥ 200 mg/dL, while the corresponding TC changes decreased mortality by 13%, 27%, 34%, 31%, 20%, and 13%, respectively, in the range < 200 mg/dL (P < 0.001 for each age group). TC had U-curve associations with mortality in each age-sex group. TC levels associated with lowest mortality were 210–249 mg/dL, except for men aged 18–34 years (180–219 mg/dL) and women aged 18–34 years (160–199 mg/dL) and 35–44 years (180–219 mg/dL). The inverse associations for TC < 200 mg/dL were stronger than the positive associations in the upper range.
Introduction
Reduction of total cholesterol (TC) has been an integral part of public health campaigns, such as Healthy People 2020 in the US and Under 5 in Norway1,2,3, as well as cardiovascular disease (CVD) risk prediction models. This goal has primarily been supported by the success of statin trials showing that statin therapy reduced mortality from ischemic heart disease (IHD)4,5. “The lower, the better” cholesterol hypothesis has been accepted by many health professionals. However, the statin trials were mainly performed in persons at a high risk of heart disease, especially in men with manifest CVD, in whom heart disease mortality constituted approximately 50% of all deaths6.
Although disease-specific morbidity and mortality, such as IHD mortality, have their analytical merits, all-cause mortality is arguably the most important endpoint for patients or the general population when assessing risk factors and the effectiveness of a treatment or a public health intervention for life-threatening diseases7. The target TC levels for public health interventions in the general population should be determined after careful consideration of the levels associated with the lowest mortality in the general population. The associations of TC and all-cause mortality, however, have been relatively infrequently examined, and the associations have been inconsistent: positive linear8, inverse9, U-curve10,11,12, and reverse-L-curve13,14 associations have all been found. Moreover, cholesterol levels differ by sex and age15,16,17,18. It is unclear whether and to what extent the associations of cholesterol with mortality differ by sex and age3,17.
Through a large prospective cohort study among over 12 million participants, we examined whether the association between TC levels and all-cause mortality varied by sex and age, and estimated the sex- and age-specific levels of TC associated with the lowest mortality. Additionally, detailed estimates of the mean (and median) concentrations of TC according to sex and age are presented.
Methods
Study population and follow-up
Ninety-seven percent of the Korean population receives compulsory health insurance through the National Health Insurance Service (NHIS). The Korean Metabolic Risk Factor (KOMERIT) study included 12,845,017 NHIS beneficiaries 18–99 years of age who underwent routine health examinations from 2001 to 200419. Persons (n = 26,136) with missing information on serum total cholesterol, fasting glucose, blood pressure, and body mass index (BMI) were excluded, as were 3,665 individuals with extreme anthropometric measures and another 210 with a missing date of the health examination. The final study population included 12,815,006 participants, who were followed until December 31, 2013 through the Resident Register of Korea. The authors were granted access to the anonymized data by the NHIS, without specific informed consent from the participants according to Korean law. This study was approved by the Institutional Review Board of Catholic Kwandong University with a waiver of informed consent. The Strengthening the Reporting of Observational Studies in Epidemiology (STROBE) checklist for cohort studies was used to guide the reporting of our study.
Data collection
Serum TC and fasting glucose were assayed using enzymatic methods. Blood pressure was measured once in a seated position using a standard mercury sphygmomanometer, and the systolic blood pressure was measured as the first Korotkoff sound. Weight and height were measured to the nearest kilogram and centimeter, respectively19. BMI was calculated by weight in kilograms divided by the square of height in meters (kg/m2). Information on smoking history, alcohol use, and known heart disease or cancers was collected via a self-administered questionnaire. A standard protocol officially registered by the Korean government was applied for health examinations and data collection. External quality assessments of clinical chemistry were regularly performed20.
Statistical analysis
Baseline TC concentrations were mainly categorized into 18 groups (mg/dL; <120, 120–129 to 270–279 in increments of 10, ≥280). The cholesterol category with the lowest mortality (220–229 mg/dL) in all participants was used as the reference. Three groups (<200 [reference, desirable], 200–239 [borderline high], and ≥240 [high]), defined according to the cut-points proposed by the National Cholesterol Education Program (NCEP) of US, were used in an additional analysis21. In the spline analysis, a restricted cubic spline transformation of TC with 5 knots (138, 170, 191, 213, and 260 mg/dL; 5th, 27.5th, 50th, 72.5th, and 95th percentiles in all participants) was used to evaluate non-linear associations.
The hazard ratios (HRs) for death were calculated using Cox proportional hazards models stratified by age (years) at baseline (18–24, 25–34, 35–44, 45–54, 55–64, 65–74, or 75–99). In the multivariable model, the following variables were adjusted for: age at baseline (continuous variable; within each age group), sex, smoking status (current smoker, former smoker, never smoker, or missing information), alcohol use frequency (none, 2 days/month-2 days/week, 3–7 days/week, or missing information), physical activity (at least once a week; yes or no), systolic blood pressure (<120, 120–139, or ≥140 mm Hg), fasting glucose (<100, 100–125, or ≥126 mg/dL), and BMI (<18.5, 18.5–24.9, 25–29.9, or ≥30 kg/m2).
The apparent optimal ranges of TC for survival were determined by a general inspection of the curvilinear association. Generally, the interval of 40 mg/dL (roughly 1 mmol/L) with the lowest risk (the lowest unweighted geometric mean of HRs in 4 consecutive TC categories in the categorical analysis, and in 5 consecutive 10-mg/dL TC levels in the spline analysis [for example, the points of 200, 210, 220, 230, 240 mg/dL]), were considered the optimal ranges.
Subgroup analyses by sex and age, as well as various categorical, spline, and linear analyses, served as sensitivity analyses. All p-values were 2-sided. All analyses used SAS version 9.4 (SAS Institute Inc., Cary, NC, USA).
Ethics approval
This study was approved by the Institutional Review Board of Kwandong University (Gangneung, Republic of Korea).
Results
During a mean 10.5 years of follow-up, 454,546 men and 239,877 women died. At baseline, the participants’ mean ± SD age was 44.4 ± 14.2 years, their mean TC level was 194.2 ± 49.0 mg/dL (Table 1), and 11.2% of participants had high TC levels (≥240 mg/dL). Individuals with higher TC levels were older and had higher levels of fasting glucose, systolic blood pressure, and BMI (Table 1). People with TC ≥240 mg/dL tended to be non-drinkers and were more likely to have comorbid heart disease, stroke, or cancer. The number of individuals was highest in the TC range of 180–189 mg/dL (Table 1, Supplementary Fig. 1).
TC concentrations according to sex and age
Men had on average higher TC levels than women between 24–25 to 48–49 years old, while women had higher levels than men in the age ranges of 18–23 years and ≥50 years (Fig. 1, Supplementary Table S1). Among men, the mean TC levels increased from 159.0 mg/dL at 18–19 years to a maximum of 201.4 mg/dL at 50–51 years, and among women, the mean levels increased from 170.5 mg/dL at 20–21 years to a maximum of 212.4 mg/dL at 56–57 years. The decrease in TC levels after the peak values were reached was greater in men than in women. The gradient of increase in TC levels with age was steepest from 18–19 to 28–29 years in men, while it was steepest from 44–45 to 52–53 years in women (Fig. 1).

Mean and median concentrations of total cholesterol. To convert cholesterol from mg/dL to mmol/L, multiply by 0.02586.
Associations between total cholesterol and mortality
U-curve associations between TC levels and mortality were found in both men and women (Fig. 2). The TC range associated with the lowest mortality was 210–249 mg/dL (Supplementary Table S2). When age was further considered, U-curve associations were observed regardless of sex or age (Fig. 3), and the optimal TC range for survival was 210–249 mg/dL for each age-sex group, except for men at 18–34 years (180–219 mg/dL) and for women at 18–34 years (160–199 mg/dL) and at 35–44 years (180–219 mg/dL) (Supplementary Table S3).

Age-adjusted hazard ratios associated with 18 total cholesterol (TC) categories, according to sex. TC categories (mg/dL: <120, 120–129 to 270–279 by 10, ≥280, 220–229 as reference). The midpoint was used as a representative value for each TC category, except for both ends (112 and 296), for which the median of all participants was used. *Hazard ratios and 95% confidence intervals were calculated using Cox hazards models stratified by baseline age (years: 18–24, 25–34, 35–44, 45–54, 55–64, 65–74, 75–84, 85–99). Age at baseline was adjusted as a continuous variable within each age group. To convert TC from mg/dL to mmol/L, multiply by 0.02586.

Hazard ratios* associated with 18 total cholesterol (TC) categories for mortality by sex and age. TC categories (mg/dL: <120, 120–129 to 270–279 by 10, ≥280, 220–229 as reference). The midpoint was used as a representative value for each TC category, except for both ends (112 and 296), for which the median of all participants was used. *Hazard ratios and 95% confidence intervals were calculated using Cox hazards models stratified by baseline age (years: 18–24, 25–34, 35–44, 45–54, 55–64, 65–74, 75–84, 85–99), after adjustment for age at baseline (continuous variable), smoking status, alcohol use, physical activity, known history of heart disease, stroke, or cancer, body-mass index, systolic blood pressure, and fasting glucose levels. To convert TC from mg/dL to mmol/L, multiply by 0.02586.
In the spline analysis (Fig. 4, Supplementary Fig. 2), the TC ranges associated with the lowest mortality were approximately 200–240 mg/dL, except for men at 18–34 years (approximately 180–220 mg/dL) and for women at 18–34 years (approximately 160–200 mg/dL) and at 35–44 years (approximately 180–220 mg/dL).

Hazard ratios* using spline transformed total cholesterol (TC) levels for mortality by sex and age. 5 knots (138, 170, 191, 213, and 260 mg/dL) were used with 220 mg/dL as reference. *Hazard ratios and 95% confidence intervals were calculated using Cox hazards models with the same method as in Fig. 3. To convert TC from mg/dL to mmol/L, multiply by 0.02586.
When assuming linear associations for TC levels of 50–449, 50–199, and 200–449 mg/dL, each 39 mg/dL (1 mmol/L) increase in TC was associated with 8% lower (HR = 0.92, 95% CI = 0.917–0.922), 23% lower (HR = 0.77, 95% CI = 0.76–0.77), and 7% higher (HR = 1.07, 95% CI = 1.06–1.07) mortality, respectively (Fig. 5).
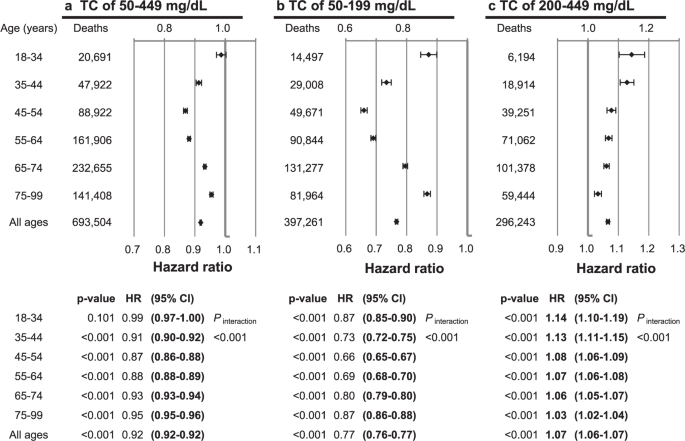
Hazard ratios* per each 39 mg/dL (1 mmol/L) increase in total cholesterol (TC), according to TC range and age. *Hazard ratios and 95% confidence intervals were calculated using Cox hazards models with the same method as in Fig. 3. To convert TC from mg/dL to mmol/L, multiply by 0.02586.
At cholesterol levels <200 mg/dL (Table 2), inverse associations were the strongest in men aged 45–54 years and women aged 55–64 years, the age group with the highest mean TC level in both sexes (Pinteraction [age] <0.001). At cholesterol levels ≥200 mg/dL, the HRs per 39 mg/dL (1 mmol/L) higher levels were highest in the youngest groups (aged 18–44 years), and lowest in the oldest group (aged 75–99) years in both sexes (Pinteraction [age] <0.001).
The associations were modestly stronger in men than in women at TC levels of 50–449, 50–199, and 200–449 mg/dL (Pinteraction [sex] <0.001 in each TC range), when all ages were combined. At cholesterol levels <200 mg/dL, men had stronger inverse associations than women in age groups <65 years.
Associations across standard classifications of TC
Compared to the desirable levels of <200 mg/dL (Supplementary Table S3), borderline high levels of 200–239 mg/dL were associated with a lower risk of mortality in each age-sex group except for women aged 18–34 years, while high levels of ≥240 mg/dL were associated with a decreased risk in both sexes and each age group except for women aged 18–44 years and men aged 18–34 years, in whom high levels were associated with increased mortality.
Discussion
A U-shaped relationship between TC and mortality was observed in each age-sex group. TC levels associated with the lowest mortality were 210–249 mg/dL in both sexes in all age groups, except for the youngest groups of men, aged 18–34 years (180–219 mg/dL), and women aged 18–34 years (160–199 mg/dL) and 35–44 years (180–219 mg/dL). At TC levels of 50–199 and 200–449 mg/dL, each 39 mg/dL (1 mmol/L) increase in TC was associated with 23% lower (95% CI = 23–24%) and 7% higher (6–7%) mortality, respectively. Inverse associations in the lower TC range were strongest at the ages for which the mean TC levels were highest (men aged 45–54 years and women aged 55–64 years), while positive associations in the upper TC range were strongest in the youngest ages (<45 years) in both sexes. Both the inverse associations in the lower TC range and the positive associations in the upper TC range weakened with advancing age beyond the ages with the strongest associations.
Previous cohort studies have reported inconsistent results on the shape of associations between TC and all-cause mortality, including positive linear, inverse, U-curve, and reverse-L-curve (or reverse-J-curve) associations3,8,9,10,11,13,14,17,22. Some previous studies suggested different shapes of associations by sex and age3,17. The associationbetween TC and mortality was substantially modified by age and, to a lesser degree, by sex, in our study. Our study clearly demonstrated that the shape of association is a U-curve in each sex and each age group, including those aged 75–99 years (mean age: 79.0 years), which constituted 154,321, 80,776, and 18,080 elderly people aged 75–79, 80–84, and ≥85 years, respectively. Considering the weaker effect size associated with high TC with advancing age in the elderly, it is no surprise that previous studies conducted mainly in elderly populations found generally inverse or reverse-L-curve associations13,14. Additionally, the previously reported positive associations in younger adults8, may be explained by the stronger positive associations and lower optimal range in younger ages observed in our study, combined with the higher TC concentrations and larger proportions of morbidity and mortality from heart diseases in Western populations.
The NCEP experts classified TC levels into 3 categories: <200, 200–239, and ≥240 mg/dL, as desirable, borderline high, and high levels, respectively, mainly based on the association between TC and IHD21. In the current study, however, TC levels of 210–249 mg/dL and approximately 200–240 mg/dL were associated with the lowest mortality in the categorical and spline analyses, respectively. Our study suggested that the optimal ranges for overall survival are higher than that those for IHD. Similarly, a higher optimal range for overall survival than for IHD mortality has also been reported for BMI23. In contrast, the optimal ranges for all-cause mortality and IHD mortality were similar for fasting glucose and blood pressure24,25,26,27. Cholesterol levels might be a marker of general health, rather than a marker specific for CVD28. Even within CVD subtypes, TC ranges associated with lowest risk have not been consistent. For example, for stroke, TC levels <200 mg/dL were not associated with the lowest mortality in prospective cohort studies29,30, and randomized trials have not provided clear evidence of whether lipid-lowering therapies, including statins, reduce stroke mortality6,31. Hemorrhagic stroke, respiratory diseases (especially chronic obstructive pulmonary disease), digestive diseases (especially liver disease), and several cancers have been suggested to be associated with lower TC levels10,30,32,33,34; thus, the ranges associated with lowest risk might be even higher for these diseases than those for all-cause mortality. However, we could not examine whether the associations differed by cause of death, due to data unavailability.
Reverse causality has been suggested as an explanation of higher mortality associated with low cholesterol levels. However, a long term follow-up study in a Japanese-American population showed that individuals with low cholesterol levels maintained over a 20-year period had the worst all-cause mortality, and concluded that reverse causality was unlikely to account for the higher mortality associated with low cholesterol entirely14.
Lower optimal ranges for survival at younger ages than at older ages have also been observed for BMI19, whereas consistent ranges have been found regardless of sex and age for blood pressure and fasting glucose26,27,29. Whether different proportions of cause-specific mortality by age lead to the lower optimal range at younger ages needs to be investigated.
The sex- and age- specific levels of TC in the current study of Koreans were lower than those reported in other high-income countries, including Japan, England, and the US15,16,17,35,36. The distribution of TC levels by sex and age, however, were generally similar to those of other regional and ethnic populations, although detailed information is not always available. TC levels peaked at 50–51 years in men and at 56–57 years in women, and after the peak age, the levels decreased more rapidly in men than in women. The crossover point of the mean TC levels between sexes occurred at the age of 50–51 years, exactly at the median age of menopause37. The steep decline in estrogen corresponds well to the sharp increase in TC in women that was observed around the time of menopause in the current study.
Randomized trials have provided evidence that statin therapy may lower the overall mortality risk in persons with increased cardiovascular risk, mostly due to the reduction of mortality from heart disease5,6. The evidence, however, may not be definitive enough to claim that “the lower the cholesterol, the better” for all-cause mortality reduction in the general population with relatively low heart disease risk38.
The current cholesterol guidelines are heavily based on heart disease risk and recommend a TC range of <200 mg/dL as desirable. TC range <200 mg/dL, however, may not be necessarily a sign of good health when other diseases are considered. The diseases associated with lower TC levels and potential mechanisms have not been conclusively identified. Since the inverse associations in lower TC range were stronger than the positive associations in upper TC range, identification of diseases associated with lower TC levels and further understanding of the mechanisms of such associations may help improve health outcomes in the general population. Pending more research for clarification, careful evaluation and management might increase the chance of preventing and diagnosing potentially life-threatening diseases at an earlier stage in adults with low TC levels.
A very large number of participants, the prospective nature of the study, and complete follow-up for death are clear strengths of this study. Another major strength is that the study participants were ethnically homogeneous and lived in a similar environment covered by the same health care system. Another strength is that this study estimated mortality risk associated with TC levels down to below 120 mg/dL. However, there are limitations. First, the use of lipid-lowering medication was unaccounted for. The risk associated with high cholesterol might have been underestimated. However, in Korea, IHD mortality accounted for only approximately 5% of all-cause mortality, and only 10% of people with hypercholesterolemia received lipid-lowering therapy39. Therefore, the impact of not considering medication use is likely to be modest, and the TC levels in this study generally reflect levels without lipid-lowering medications. Additionally, this study could not determine whether statin-induced low cholesterol increases mortality. Second, other lipid measures, such as low-density lipoprotein and high-density lipoprotein cholesterol levels, were unavailable. Recent dyslipidemia management guidelines are more closely focused on these sub-fractions of cholesterol, so the direct application of our findings to individual patient care might be somewhat limited. Further study is needed to determine the sex- and age-specific associations of cholesterol fractions. Third, information on cause-specific mortality was not available. Fourth, the generalizability of our findings may be affected by the fact that the study participants were homogeneously Korean. The U-curve associations may be generalized to other ethnic populations, since the shape of the associations was generally the same for each sex and each age group, despite their varying cardiometabolic risk profiles. However, some results, such as the magnitude of relative risk associated with TC and the TC range associated with the lowest mortality, may vary by ethnic groups with different distributions of cause-specific mortality and dyslipidemia-related healthcare utilization.
In conclusion, U-curve relationships between TC and mortality were found, regardless of sex and age. TC ranges associated with the lowest mortality were 210–249 mg/dL in each sex-age subgroup, except for the youngest groups of men, aged 18–34 years (180–219 mg/dL), and women aged 18–34 years (160–199 mg/dL) and 35–44 years (180–219 mg/dL). Inverse associations in the range <200 mg/dL were more than 3-fold stronger than positive associations for cholesterol levels ≥200 mg/dL, except for the youngest adults. Positive associations in the upper TC range were strongest for youngest adults and weakened with advancing age. TC levels <200 mg/dL may not necessarily be a sign of good health. Identification and proper management of diseases associated with lower TC levels might improve survival.
Data Availability
The data supporting the findings of this study are available from the NHIS, but restrictions apply to the availability of these data, which were used under license for the current study; therefore, the data are not publicly accessible.
References
Benjamin, E. J. et al. Heart Disease and Stroke Statistics-2017 Update: A Report From the American Heart Association. Circulation. 135, e146–e603 (2017).
US Department of Health and Human Services. Healthy People 2020. 2020 Topics & Objective: Heart Disease and Stroke. https://www.healthypeople.gov/2020/topics-objectives/topic/heart-disease-and-stroke/objectives AccessedNovember 21, 2018.
Petursson, H., Sigurdsson, J. A., Bengtsson, C., Nilsen, T. I. & Getz, L. Is the use of cholesterol in mortality risk algorithms in clinical guidelines valid? Ten years prospective data from the Norwegian HUNT 2 study. J Eval Clin Pract. 18, 159–68 (2012).
Cholesterol Treatment Trialists Collaborators, Mihaylova, B. et al. The effects of lowering LDL cholesterol with statin therapy in people at low risk of vascular disease: meta-analysis of individual data from 27 randomised trials. Lancet 380, 581–90 (2012).
Chou, R., Dana, T., Blazina, I., Daeges, M. & Jeanne, T. L. Statins for Prevention of Cardiovascular Disease in Adults: Evidence Report and Systematic Review for the US Preventive Services Task Force. JAMA. 316, 2008–2024 (2016).
Cholesterol Treatment Trialists Collaboration, Baigent, C. et al. Efficacy and safety of more intensive lowering of LDL cholesterol: a meta-analysis of data from 170,000 participants in 26 randomised trials. Lancet 376, 1670–81 (2010).
PDQ Adult Treatment Editorial Board. Levels of Evidence for Adult and Pediatric Cancer Treatment Studies (PDQ(R)): Health Professional Version. 2017 May 19. Available from: https://www.ncbi.nlm.nih.gov/books/NBK65748/. PDQ Cancer Information Summaries [Internet]. Bethesda (MD): National Cancer Institute (US), 2002.
Stamler, J. et al. Relationship of baseline serum cholesterol levels in 3 large cohorts of younger men to long-term coronary, cardiovascular, and all-cause mortality and to longevity. JAMA. 284, 311–8 (2000).
Casiglia, E. et al. Predictors of mortality in very old subjects aged 80 years or over. Eur J Epidemiol. 9, 577–86 (1993).
Jacobs, D. et al. Report of the Conference on Low Blood Cholesterol: Mortality Associations. Circulation. 86, 1046–60 (1992).
Kirihara, Y., Hamazaki, T., Ogushi, Y., Tsuji, H. & Shirasaki, S. The Relationship between Total Blood Cholesterol Levels and All-cause Mortality in Fukui City, and Meta-analysis of This Relationship in Japan. J Lipid Nutr 17, 67–78 (2008).
Lin, Y. C. et al. Different effect of hypercholesterolemia on mortality in hemodialysis patients based on coronary artery disease or myocardial infarction. Lipids Health Dis. 15, 211 (2016).
Petersen, L. K., Christensen, K. & Kragstrup, J. Lipid-lowering treatment to the end? A review of observational studies and RCTs on cholesterol and mortality in 80+ -year olds. Age Ageing. 39, 674–80 (2010).
Schatz, I. J. et al. Cholesterol and all-cause mortality in elderly people from the Honolulu Heart Program: a cohort study. Lancet. 358, 351–5 (2001).
Lawes, C. M. M., Hoorn, S. V., Law, M. R. & Rodgers, A. Chapter 7. High cholesterol. In: Ezzati, M., Lopez, A. D., Rodgers, A., Murray, C. J. eds. Comparative Quantification of Health Risks: Global and Regional Burden of Disease Attributable to Selected Major Risk Factors. Vol. 1. (Geneva: World Health Organization, 2004).
Roth, G. A. et al. High total serum cholesterol, medication coverage and therapeutic control: an analysis of national health examination survey data from eight countries. Bull World Health Organ. 89, 92–101 (2011).
Ulmer, H., Kelleher, C., Diem, G. & Concin, H. Why Eve is not Adam: prospective follow-up in 149650 women and men of cholesterol and other risk factors related to cardiovascular and all-cause mortality. J Womens Health (Larchmt). 13, 41–53 (2004).
Park, J. H. et al. Effects of age, sex, and menopausal status on blood cholesterol profile in the korean population. Korean Circ J. 45, 141–8 (2015).
Yi, S. W., Ohrr, H., Shin, S. A. & Yi, J. J. Sex-age-specific association of body mass index with all-cause mortality among 12.8 million Korean adults: a prospective cohort study. Int J Epidemiol. 44, 1696–705 (2015).
Min, W. K. et al. Annual Report on External Quality Assessment in Clinical Chemistry in Korea. J Lab Med Qual Assur. 2003(25), 1–14 (2002).
National Cholesterol Education Program Expert Panel on Detection E. Treatment of High Blood Cholesterol in A. Third Report of the National Cholesterol Education Program (NCEP) Expert Panel on Detection, Evaluation, and Treatment of High Blood Cholesterol in Adults (Adult Treatment Panel III) final report. Circulation. 106, 3143–421 (2002).
Song, Y. M., Sung, J. & Kim, J. S. Which cholesterol level is related to the lowest mortality in a population with low mean cholesterol level: a 6.4-year follow-up study of 482,472 Korean men. Am J Epidemiol. 151, 739–47 (2000).
Prospective Studies Collaboration, Whitlock, G. et al. Body-mass index and cause-specific mortality in 900 000 adults: collaborative analyses of 57 prospective studies. Lancet. 373, 1083–96 (2009).
Emerging Risk Factors Collaboration, Sarwar, N. et al. Diabetes mellitus, fasting blood glucose concentration, and risk of vascular disease: a collaborative meta-analysis of 102 prospective studies. Lancet 375, 2215–22 (2010).
Lewington, S., Clarke, R., Qizilbash, N., Peto, R. & Collins, R. Prospective Studies Collaboration. Age-specific relevance of usual blood pressure to vascular mortality: a meta-analysis of individual data for one million adults in 61 prospective studies. Lancet. 360, 1903–13 (2002).
Yi, S. W. et al. Low Systolic Blood Pressure and Vascular Mortality Among More Than 1 Million Korean Adults. Circulation. 133, 2381–90 (2016).
Yi, S. W. et al. Association between fasting glucose and all-cause mortality according to sex and age: a prospective cohort study. Sci Rep. 7, 8194 (2017).
Ko, D. T. et al. High-Density Lipoprotein Cholesterol and Cause-Specific Mortality in Individuals Without Previous Cardiovascular Conditions: The CANHEART Study. J Am Coll Cardiol. 68, 2073–2083 (2016).
Prospective Studies Collaboration, Lewington, S. et al. Blood cholesterol and vascular mortality by age, sex, and blood pressure: a meta-analysis of individual data from 61 prospective studies with 55,000 vascular deaths. Lancet 370, 1829–39 (2007).
Yi, S. W., Shin, D. H., Kim, H., Yi, J. J. & Ohrr, H. Total cholesterol and stroke mortality in middle-aged and elderly adults: A prospective cohort study. Atherosclerosis. 280, 211–7 (2018).
De Caterina, R. et al. Cholesterol-lowering interventions and stroke: insights from a meta-analysis of randomized controlled trials. J Am Coll Cardiol 55, 198–211 (2010).
Kitahara, C. M. et al. Total cholesterol and cancer risk in a large prospective study in Korea. J Clin Oncol. 29, 1592–8 (2011).
Neaton, J. D. et al. Serum cholesterol level and mortality findings for men screened in the Multiple Risk Factor Intervention Trial. Multiple Risk Factor Intervention Trial Research Group. Arch Intern Med. 152, 1490–500 (1992).
Strohmaier, S. et al. Total serum cholesterol and cancer incidence in the Metabolic syndrome and Cancer Project (Me-Can). PLoS One. 8, e54242 (2013).
Arai, H. et al. Serum lipid survey and its recent trend in the general Japanese population in 2000. J Atheroscler Thromb. 12, 98–106 (2005).
Carroll, M. D., Kit, B. K., Lacher, D. A., Shero, S. T. & Mussolino, M. E. Trends in lipids and lipoproteins in US adults, 1988-2010. JAMA. 308, 1545–54 (2012).
Gold, E. B. The timing of the age at which natural menopause occurs. Obstet Gynecol Clin North Am. 38, 425–40 (2011).
Leibowitz, M. et al. Association Between Achieved Low-Density Lipoprotein Levels and Major Adverse Cardiac Events in Patients With Stable Ischemic Heart Disease Taking Statin Treatment. JAMA Intern Med. 176, 1105–13 (2016).
Lee, Y. H. et al. Serum cholesterol concentration and prevalence, awareness, treatment, and control of high low-density lipoprotein cholesterol in the Korea National Health and Nutrition Examination Surveys 2008–2010: Beyond the Tip of the Iceberg. J Am Heart Assoc. 3, e000650 (2014).
Acknowledgements
The authors thank the staff at the Big Data Steering Department at the NHIS of Korea for providing the data and support.
Author information
Authors and Affiliations
Contributions
S.W.Y. conceived the study concept and design, acquired the data, statistically analyzed the data and wrote the first draft. S.W.Y., J.J.Y. and H.O. analyzed and interpreted the data and contributed to critical revision of the manuscript. All authors have read and approved the final submitted version of the manuscript. S.W.Y. is the study guarantor.
Corresponding author
Ethics declarations
Competing Interests
The authors declare no competing interests.
Additional information
Publisher’s note: Springer Nature remains neutral with regard to jurisdictional claims in published maps and institutional affiliations.
Supplementary information
Rights and permissions
Open Access This article is licensed under a Creative Commons Attribution 4.0 International License, which permits use, sharing, adaptation, distribution and reproduction in any medium or format, as long as you give appropriate credit to the original author(s) and the source, provide a link to the Creative Commons license, and indicate if changes were made. The images or other third party material in this article are included in the article’s Creative Commons license, unless indicated otherwise in a credit line to the material. If material is not included in the article’s Creative Commons license and your intended use is not permitted by statutory regulation or exceeds the permitted use, you will need to obtain permission directly from the copyright holder. To view a copy of this license, visit http://creativecommons.org/licenses/by/4.0/.
About this article

Cite this article
Yi, SW., Yi, JJ. & Ohrr, H. Total cholesterol and all-cause mortality by sex and age: a prospective cohort study among 12.8 million adults. Sci Rep 9, 1596 (2019). https://doi.org/10.1038/s41598-018-38461-y
Received:
Accepted:
Published:
DOI: https://doi.org/10.1038/s41598-018-38461-y
This article is cited by
-
Association between total cholesterol levels and all-cause mortality among newly diagnosed patients with cancer
Scientific Reports (2024)
-
Ten-year risk assessment for cardiovascular diseases using ASCVD risk estimator plus: outcomes from hypertension and diabetes patients
Diabetology & Metabolic Syndrome (2023)
-
Lysosomal control of senescence and inflammation through cholesterol partitioning
Nature Metabolism (2023)
-
Gender differences in clinical and biochemical parameters among patients hospitalized for schizophrenia: towards precision medicine
European Archives of Psychiatry and Clinical Neuroscience (2023)
-
Epicardial fat and insulin resistance in healthy older adults: a cross-sectional analysis
GeroScience (2023)
Comments
By submitting a comment you agree to abide by our Terms and Community Guidelines. If you find something abusive or that does not comply with our terms or guidelines please flag it as inappropriate.
