
Abstract
A color gamut quantitatively describes the diversity of a taxon’s integumentary coloration as seen by a specific organismal visual system. We estimated the plumage color gamut of hummingbirds (Trochilidae), a family known for its diverse barbule structural coloration, using a tetrahedral avian color stimulus space and spectra from a taxonomically diverse sample of 114 species. The spectra sampled occupied 34.2% of the total diversity of colors perceivable by hummingbirds, which suggests constraints on their plumage color production. However, the size of the hummingbird color gamut is equivalent to, or greater than, the previous estimate of the gamut for all birds. Using the violet cone type visual system, our new data for hummingbirds increases the avian color gamut by 56%. Our results demonstrate that barbule structural color is the most evolvable plumage coloration mechanism, achieving unique, highly saturated colors with multi-reflectance peaks.
Introduction
Coloration has many functions in the lives of animals, including sexual and social communication, crypsis, aposematism, thermoregulation, and more1. The phenomenon of animal coloration involves a cascade of physical and biological events beginning with the transmission of ambient light through an animal’s habitat and incident on its body, interacting with pigments and optical nanostructures in the animal integument, and reflecting back into the environment. The sensory component occurs when this light is transmitted through another individual’s eye and is absorbed by ocular pigments, leading finally to a perception of color. The field of sensory ecology encompasses research on all aspects of this cascade of phenomena1.
An important complement to traditional autecological approaches to sensory ecology, which focus on the sensory challenges and communication mechanisms of individual species, is comparative methods that investigate the evolutionary radiation in color production and sensory systems among species. From this perspective, a color gamut refers to the achieved color diversity of a species, clade, or guild as quantified in the taxonomically appropriate color space. The color gamut of a clade is a consequence of selection acting on integumentary colors and color patterns with superior functions, and the physical, biochemical, and developmental mechanisms that facilitate, bias, and constrain the possible diversity in integumentary colors2. Examples include the pelage color gamut of primates as perceived by di- and trichromatic primate species3 and the plumage color gamut of a comprehensive sample of all living birds using a tetrahedral color space based on avian retinal physiology2.
Among the most colorful groups of animals, birds have been studied extensively in sensory ecology1. In order to properly understand how birds see the world and themselves, theoretical models of bird color vision must consider that birds have tetrachromatic vision; birds possess four retinal color cone types, which allow birds to see ultraviolet/violet (uv/v) wavelengths in addition to red (long, l), green (medium, m), and blue (short, s) wavelengths4. To quantify avian color perceptions, researchers have employed 3D tetrahedral avian color space models5,6 that represent all the colors birds can see and distinguish. A color gamut is then defined as the minimum volume covered by a set of color points in an appropriate color space.
Stoddard and Prum2 used a tetrachromatic color space based on avian retinal physiology to estimate the total avian color gamut for different avian visual systems. Based on a broad sample of 965 reflectance spectra from plumage patches belonging to 111 species of birds selected to encompass the known diversity of avian color production mechanisms, Stoddard and Prum2 documented that the avian color gamut occupies an unexpectedly small portion of the avian color space– between 26% and 30% of the total differentiable colors (for the avian violet-sensitive, VS, and ultraviolet-sensitive, UVS, visual systems, respectively). Furthermore, they established that pigments comprise a much smaller volume of the avian color gamut than do structural coloration mechanisms, particularly barbule structural colors which are created by constructive interference from layers of melanosomes in the feather barbules2. A comparative phylogenetic analysis indicated that novelties in color production mechanism– including the evolutionary origin of new pigmentary and structural coloration mechanisms– have evolved in various avian lineages and expanded the color gamut achieved by those clades2.
Stoddard and Prum sampled 96 plumage patches with barbule structural coloration including reflectance spectra from three hummingbird species. Given the overwhelming contribution of barbule structural colors (~35%) to the avian color gamut, Stoddard and Prum2 predicted that a more comprehensive sample of barbule structural colors would likely expand the avian color gamut substantially, particularly with saturated blue and green hues. Saturated blue and green plumage hues are relatively rare in birds because they require the production of narrow reflectance peaks that stimulate only the small or medium wavelength cones, which have very closely-spaced spectral sensitivies4,7. However, barbule structural coloration mechanisms can achieve more saturated colors than avian pigments8. By controlling the average thickness of the nanostructures, barbule structural colors can theoretically achieve a complete spectral diversity of saturated hues from ultraviolet to red.
To better estimate the contribution of feather barbule structural colors to the avian plumage gamut, we investigated the plumage color gamut of the hummingbird family (Trochilidae), which is well known for the diversity and complexity of its barbule structural coloration9,10,11,12,13,14 (Fig. 1). Using reflectance spectra from over 1600 plumage patches from 114 species of hummingbirds from 68 genera (encompassing one third of all species and 60% of genera in the family), we applied a tetrahedral model of avian color space to: (1) quantify the total plumage color gamut and hue distribution of hummingbirds, (2) revise estimates of the contribution of hummingbirds and barbule structural colors to the total avian plumage color gamut, and (3) revisit the hypothesis that different plumage coloration mechanisms bring different constraints on achievable color diversity. We found that the hummingbird plumage color gamut fills more than a third of avian color space and exceeds that previously documented for all of birds. Additionally, we show that the plumage patches typically used in social communication have larger color gamuts, and we hypothesize that hummingbird plumage coloration has evolved to create more saturated colors within the hummingbird color visual system.
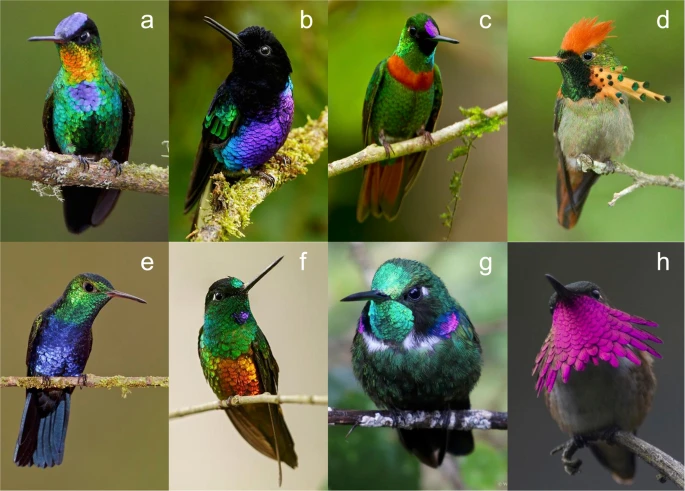
Photographs of males of eight of the 114 hummingbirds analyzed, showing the incredible diversity of hummingbird plumage color, including saturated blues, greens, and purples. a Panterpes insignis, b Boissonneaua jardini, c Heliodoxa aurescens, d Lophornis ornatus, e Juliamyia julie, f Coeligena bonapartei, g Schistes geoffroyi, and h Atthis ellioti. Photos reproduced with permission of: a–f Glenn Bartley; g Wilmer Quiceno; h John Cahill.
Results
Hummingbird plumage color gamut
The hummingbird plumage coloration gamut occupies 34.2% of the total avian VS cone type color space (Table 1 and Fig. 2; see Fig. 3 for explanation of tetrachromatic avian color space model). The barbule structural colors and melanin patches (i.e., phaeomelanin or eumelanin patches with absence of structural coloration) of hummingbirds occupy 34.0% and 0.775% of the VS color space, respectively (Table 1; Supplementary Fig. 1). Unsurprisingly, hummingbird white (unpigmented) colors contribute the least to the hummingbird color gamut, 0.0148% of VS color space (Table 1; Supplementary Fig. 1). In contrast to previous analyses of avian color diversity2,14,15, the hummingbird color gamut occupies a larger volume in the VS color space (34.2%) than in the UVS color space (29.6%) (Table 1; Supplementary Fig. 2).

a–c The distribution of color points of our hummingbird data (gray) and Stoddard and Prum’s (2011) data for all birds (black) in an avian VS color space viewed from different directions: a standard angle, b a top-down view displaying the expansion of hummingbird plumage colors in s-, m-, and l- dimensions, and c a view toward the l-m edge from slightly below displaying the expansion of hummingbird colors toward the s-v-l face of the color space, and the paucity of color points in the m+ uv/v region of the color space. d Corresponding Robinson projection of color point hues showing the expansion of hummingbird colors in terms of hues, especially in the s−, s+ m−, s+l−, and s+l+uv/v− regions.

The avian perception of a reflectance spectrum is represented as a point in color space determined by the relative stimulation of the ultraviolet or violet (uv/v), blue (s), green (m), and red (l) retinal cones. The center of the tetrahedron is the achromatic origin, which represents equal cone stimulation– either white, black, or gray. Each color point is defined by the angles θ and φ, which define the hue, and the distance r, which defines the chroma or saturation (reproduced from Stoddard and Prum 2008).
When analyzing resampled subsets of our 114 species of hummingbird, average color gamut volume for subsets of 90 species or greater approaches the value of our full data set (Supplementary Fig. 3 and Supplementary Table 1). Likewise, the standard deviation of gamut volume becomes increasingly negligible as species sample size approaches that of our study (coefficient of variation = 0.0455 at 110 species, n = 10 data subsets; Supplementary Table 1). This result indicates that our species sample is more than sufficient in size. However, it also demonstrates the importance of individual species to our final result. All outliers below the average color gamut for each species subset size are those samples that excluded Boissonneaua jardini, the hummingbird species with the largest achieved species color gamut volume (see species color gamut volumes below in Table 2).
Different plumage regions in hummingbirds achieve distinct color gamut volumes (Table 3; Supplementary Fig. 4), indicating differences in the history of social, sexual, and natural selection on these patches (See Discussion). The largest patch gamuts are those for crowns and gorgets (23.1% and 31.0% of VS color space, respectively) while the two smallest patch gamuts are those of undertail coverts (3.65% of VS color space) and wings (2.62% of VS color space; Table 3 and Supplementary Fig. 4).
Contribution of the hummingbirds to the total avian color gamut
The breadth of the complete hummingbird color gamut exceeds (VS) or is equivalent to (UVS) the previous estimate of the total color gamut of all living birds2 (Table 1). Our resampling shows that the VS hummingbird color gamut on average exceeds that of the previous estimate of all birds even when only including 60 species of hummingbird (Table 1, Supplementary Fig. 3; Supplementary Table 1). Hummingbirds expand the known avian color gamut by occupying areas of the avian color space that have not been previously documented. The color gamut and Robinson projections of the hue of hummingbird colors reveal that hummingbird colors densely occupy the m (green), the m–s (green-blue), and the s (blue) regions of the color space and hue map (Fig. 2). Notably, there are several hummingbird spectra that occupy the s + l (true purple) wavelength region of VS avian color space, which was sparsely occupied in Stoddard and Prum (Fig. 2)2.
When the hummingbird data is combined with Stoddard and Prum’s data2, the revised avian color gamut occupies a total of 40.5% of the total VS color space (Table 1 and Fig. 2), which constitutes a 56.0% increase in known gamut volume. From another perspective, the hummingbird color gamut comprises 84.5% of the revised, total known avian color gamut (Table 1). The expansion of the known avian color gamut by hummingbirds is entirely due to the contributions of structural barbule colors. The estimated volume of the avian barbule structural color gamut increased by over 270%, or over three-fold (depending on visual system type), from Stoddard and Prum’s2 estimate– an increase from 9.2% to 34% of the VS color space. In fact, the hummingbird structural barbule color gamut alone exceeds the previously known avian VS plumage gamut of all birds, and is equivalent to the total known avian UVS plumage gamut reported by Stoddard and Prum2 (Table 1; Supplementary Table 2).
Species color gamuts
The color gamuts of individual hummingbird species vary tremendously from a maximum of 13.8% of the VS color space in the Velvet-purple Coronet, Boissonneaua jardini (Fig. 1b) to a minimum of 0.0725% for the Giant Hummingbird, Patagonia gigas, which mostly has melanin plumage colors (Supplementary Data 1; Supplementary Fig. 5). The average species color gamut volume is 2.04% of the VS color space. Nine hummingbird species have larger color gamuts than the largest species plumage color gamut previously documented2: the Papuan Lorikeet (Charmosyna papou) with a color volume of 4.67% in UVS color space (Table 2). Thus, not only are hummingbirds an extremely color-diverse family, but they include the nine most diversely colored species of birds known. However, this comparison may be biased for several reasons. Some methodological differences may contribute to the differences in these results from those of Stoddard and Prum. We made many more reflectance measurements per bird (18+ measurements) than Stoddard and Prum2 (6–13 measurements). Furthermore, to preserve the natural diversity in coloration due to iridescence, we did not average together the multiple reflectance spectra per patch.
Notable hummingbird colors
By examining outliers both in the hummingbird color gamut and in the previously known avian color gamut2, we identified unusual reflectance spectra that contribute to novel plumage colors among birds (Figs. 4, 5). For example, the gorget of Boissonneaua jardini is notable because it is the first barbule structural color reflectance spectrum that we know of with a single, saturated peak in the uv/v wavelength component (λmax 419 nm; Figs. 1b, 4c, 5). Several Heliangelus species are known to have substantial reflectance in the near ultraviolet and violet wavelengths15, but always with extensive reflectance of longer wavelengths creating an ultraviolet-red color. For example, the Heliangelus viola gorget spectrum has a prominent, saturated uv/v peak (λmax 420 nm) with a second, saturated, bright peak in the red (λmax 656 nm; Figs. 4d, 5). Smaller wavelength secondary peaks were found in many species of hummingbird. However, the creation of secondary peaks with such saturated uv/v peaks was only found in the spectra of a few other species, including the gorgets of Chalcostigma stanleyi, Oreonympha nobilis, Schistes geoffroyi, and Metallura phoebe. Thus, while this type of reflectance spectrum is not restricted to Heliangelus, it should still be considered rare. The gorgets of both Boissonneaua jardini and Heliangelus viola expand the total avian gamut in terms of saturated UV/V colors (Fig. 5; Supplementary Fig. 2). Yet overall, the saturated UV/V portions of avian color space are sparsely occupied by hummingbirds (Fig. 2; Supplementary Fig. 2).

a, b saturated green + UV reflectance, c, d UV saturated reflectance, e, f low reflectance spectra with unusual UV component, g, h true purple reflectance (i.e., s + l), i, j saturated blue + green (m + l) reflectance, k highly saturated blue, and l highly saturated green (right) spectra. Spectra are labeled with the first two letters of the genus and species names and the patch: a, g Schistes geoffroyi, b Metallura phoebe, c Boissonneaua jardini, d Heliangelus viola, e Trochilus polytmus, f Klais guimeti, h Atthis ellioti ellioti, i Metallura tyrianthina smaragdinicollis, j Coeligena torquata fulgidigula, k Aglaiocercus coelestis coelestis, and l Urosticte benjamini. Reflectance spectra are in arbitrary units (See Methods).

Unusual hummingbird plumage spectra (gray) from Fig. 4 with the total avian color gamut (black) from Stoddard and Prum (2011) a–c plotted in avian VS color space and viewed from three angles: a standard view, b a top-down view, and c a view toward the l-m edge from slightly below. d Robinson projection of the hues of the same color points. All spectra are labeled with the first two letters of the genus and species: Ag-co– Aglaiocercus coelestis coelestis, At-el– Atthis ellioti ellioti, Bo-ja– Boissonneaua jardini, Co-to– Coeligena torquata fulgidigula, He-vi– Heliangelus viola, Kl-gu– Klais guimeti, Me-ph– Metallura phoebe, Me-ty– Metallura tyrianthina smaragdinicollis, Sc-ge– Schistes geoffroyi, Tr-po– Trochilus polytmus, and Ur-be–Urosticte benjamini.
The production of structural colors with multiple harmonic peaks in the visible spectrum allows some hummingbird species to create colors in the green + UV/V region (Figs. 2, 4, 5), formerly recognized as a vacant hue “ocean”2, and to fully occupy the true purple (s + l) region of the color space (Fig. 2). Such distinctive colors include the cheek, crown, and gorget of Schistes geoffroyi, which create unique reflectance spectra with three apparently harmonic peaks (cheek and crown shown in Figs. 1g, 4a, g, 5). No other reflectance spectra measured in this study show similar peaks.
Discussion
The avian plumage color gamut is much more diverse than previously estimated2. We demonstrate that hummingbird barbule structural colors contribute substantially to the total color diversity of living birds, occurring in areas of the avian color space that were sparsely occupied in Stoddard and Prum2, which most notably included saturated blues, greens, and true purples (blue + red). Such regions of the avian color space were suggested to be unoccupied because these colors are challenging to create, rather than because they might function poorly for communication2. Our results support this hypothesis because hummingbird coloration densely occupies these regions of the avian color gamut (Fig. 2d), using plumage patches that generally play particularly important roles in hummingbird communication, such as throat and crown plumage patches (Supplementary Fig. 5)16,17. The greater color diversity uncovered by our study suggests that barbule structural coloration is the most versatile class of all plumage coloration mechanisms and poses the least constraints on the evolvability of plumage color diversity. Barbule structural colors evolve through changes in the size, shape, spacing, and refractive index of barbule melanosome nanostructures, but little is known about how changes in these parameters themselves evolve18.
The UV/V + green region of avian color space remains mostly unoccupied (Fig. 2c, d). It is challenging to create colors with separate reflectance peaks within the wavelength sensitivities of non-adjacent color cones because the peaks must be highly saturated to avoid stimulating neighboring cones2. However, this idea does not explain why there are far more true purple (blue + red) than UV/V + green plumage colors. Notably, birds particularly fail to fill the more UV/V regions (those closer to the UV/V vertex) of UV/V + green color space, which might indicate that it is difficult to create spectra with uv/v wavelength peaks higher than those in the m wavelengths.
The differences between our methods and those of Stoddard and Prum2 likely contribute in part to the larger gamut size when comparing species data but not overall data. While the number of species included in our study was comparable to that of Stoddard and Prum2 (114 vs 111 species, respectively), we measured almost twice as many plumage patches as they did (+1600 vs. 965 patches). To prevent erroneous distortion to iridescent colors we did not average the three measurements per patch. Both studies measured six standard patches for all species and additional patches if necessary to capture other plumage color variation. The larger number of plumage patches we measured reflects how color diverse hummingbird plumages are. Our methods preserved the natural variation in hue due to iridescence and avoided the distorted flattening caused by averaging highly saturated peaks with slightly different peak hues. Although our methods are biased toward increasing variation, they are necessary to accurately capture the phenomenon of iridescent hummingbird coloration.
There are multiple reasons why the hummingbird color gamut is so diverse. The size of the hummingbird color gamut, like the achieved color gamut of any clade, constitutes a combination of the history of selection on color function, the clade’s evolved capacities for color production, the age of the clade, and the number of species. Hummingbirds excel at all these criteria. The 336 species of extant hummingbirds have radiated rapidly over the last 22 million years19. Hummingbird plumage color diversity has evolved through a long history of persistent sexual and social selection on plumage coloration. Hummingbirds have polygynous breeding systems characterized by female only parental care, female mate choice, and often elaborate male courtship displays. Intersexual selection in hummingbirds has contributed to elaborate radiation in brilliant plumage coloration as well as vocalizations and non-vocal feather sounds14,16,20. Hummingbird plumage color evolution rates have even been shown to positively correlate with hummingbird speciation rates14. Furthermore, in some species, brilliant monomorphic plumage ornaments apparently function in aggressive, intra- and interspecific defense of floral resources21 and appear to be associated with socioecological features related to resource competition19. Our finding that crown and throat patches, which flash brilliantly when the head of the bird is oriented toward the observer, are more diverse in coloration than other plumage regions highlights the role of plumage coloration in direct inter-individual communication and social interactions.
The mechanistic properties of hummingbird barbule structural color further explain the exceptional diversity of hummingbird plumage coloration. Hummingbird barbule structural coloration is among the most complex plumage coloration mechanisms, comprised of stacks of hollow, air-filled melanosomes, surrounded by a thin superficial, solid keratin cortex as well as sometimes superficial, miniature melanin platelets which lie just beneath this cortex9,10,11,12,13. Complex nanostructures allow for independent tuning of multiple components, and, hence, greater achievable color diversity12,18,22. Barbule structural color permits the production of any peak-reflected wavelength by varying the thickness of melanosome arrays, which can produce a diversity of single-peak spectra-hues, such as the unusual diversity of greens, blues, and blue + greens seen in hummingbirds (Fig. 2b). Hummingbird melanosomes are among the most unusual in birds in being both disc-shaped and air-filled9,10,11,12,13,23. The air in the center of hummingbird melanosomes approaches the maximum possible biological difference in refractive index (air = 1.0, melanin = ~1.7), which results in the efficient production of brilliant colors with the fewest layers of melanosomes, such that resulting spectra are narrow and near saturation13,24. Such spectra can thereby create colors that extend further in color space (Fig. 2a–c).
Barbule structural color also allows for the production of plumage spectra with multiple saturated peaks, creating saturated color combinations that are not as commonly produced via other plumage coloration mechanisms. However, researchers have yet to identify exactly how hummingbird multipeak spectra are produced12,13, emphasizing the need for further analyses of the optics of hummingbird feathers. Many hummingbird melanosome arrays are non-ideal– i.e., the products of the thicknesses and refractive indices of the melanin and air cavity layers are not equal25. Non-ideal thin films can create more highly saturated, pure tone colors of the primary peak while also introducing additional, harmonic spectral peaks at shorter wavelengths25, which allows for complex reflectance spectra with multiple bright peaks within the avian visible spectrum. Also, melanosome arrays with a large average layer thickness (>~300 nm) can create colors with fundamental interference peaks in the infrared and multiple, harmonic peaks in the avian visible range (300–700 nm). The presence of minute, superficial melanin platelets below the cortex in hummingbird barbules is also correlated with secondary, lower wavelength reflectance peaks, but the precise optical mechanism remains to be established12. These different nanostructural elements all contribute to distinctive multipeak reflectance spectra that can stimulate non-adjacent color cone combinations, which Stoddard and Prum2 identified as particularly difficult to accomplish: UV/V-purple (uv/v + s + l wavelengths; Schistes geoffroyi cheek, Fig. 4g); true purple (s + l wavelengths; Atthis ellioti gorget, Fig. 4h); UV/V-green (uv/v + m; Schistes geoffroyi crown, Fig. 4a); and UV/V-red (uv/v + l; Heliangelus viola, Fig. 4b). With multipeak spectra the potential for creating new and different colors is greatly expanded, allowing for a more versatile evolution of novel colors.
Unexpectedly, the hummingbird plumage color gamut is larger in volume when modeled with the VS-type (34.2%) than with the UVS-type (29.6%) visual system. This apparently unique result contrasts notably with both Stoddard and Prum’s2 and our revised estimate of the color gamut of all birds combined– VS gamut = 40.5%; UVS gamut = 47.3%. Multiple previous analyses have shown that the UVS cone-type visual system does a more efficient job of discriminating the colors of natural objects because of the broader separation between the peak spectral sensitivities of the uv and s (blue) cone types2,26,27. Because the UVS-type visual system produces an even greater increase in color volume for a diverse plant color data set over the VS-type visual system, Stoddard and Prum2 rejected the hypothesis that the UVS-type visual system had specifically evolved to expand the diversity of avian color stimuli.
However, our observations that the hummingbird plumage gamut is substantially greater in volume with the VS-visual system than with the more efficient UVS-visual system strongly suggests another hypothesis: Hummingbird plumage may have specifically evolved to be more diverse within the hummingbird VS-type color visual system via selection for highly saturated plumage colors. Given diversity in hue, the way to achieve greater color gamut volume, i.e., greater plumage color diversity, is through highly chromatic color vectors that extend toward the limits of the color space. The two visual systems map variation in wavelength to different maximum potential chroma—i.e., wavelengths with color vectors that extend toward the edges, faces, and vertices of the tetrahedron6. Color vectors that extend towards the vertices, i.e., plumage that best corresponds to a singular cone type’s peak sensitivity, have the highest maximum potential chroma because vertices are the regions furthest away from the tetrahedron’s center. Thus, hummingbird plumages may have specifically evolved to have maximum chroma within their own VS-visual system via peaks that correspond most closely to the peak sensitivities of the VS- rather than the UVS-visual system. For example, when comparing the UVS and VS plumage color gamuts for hummingbirds, it is notable that hummingbird coloration extends much further into the UV/V regions of color space for the VS-visual system (Supplementary Fig. 2). While in the VS system these color points map toward the v vertex, in the UVS-visual system they map towards the uv-s edge and the uv-s-l face. Such color vectors that contribute to expanded color volume of the VS gamut could have evolved by sexual or social selection for highly saturated plumage colors that are near in hue to the specific sensitivity peaks of hummingbird receptor cone types. Such selection could note preferences within some hummingbird species for hues with maximally possible chroma, not merely for maximal chroma of a given hue.
Hummingbirds have tetrachromatic color vision with substantial sensitivity in the near ultraviolet28,29. Recently, Stoddard et al.30 used a series of elegant experiments with hummingbird feeders and LED lights to demonstrate for the first time that hummingbirds can distinguish non-spectral colors distributed throughout the tetrachromatic color space. However, the presence of this remarkably proficient four-color vision in hummingbirds poses an interesting evolutionary conundrum. Recent phylogenetic analyses have established that hummingbirds and swifts are phylogenetically embedded within the nocturnal caprimulgiforms31,32. The most parsimonious hypothesis is that the immediate ancestors of swifts and hummingbirds were extensively nocturnal for approximately 8 million years before they re-evolved diurnal ecology and behavior31. Given that an evolutionary history of nocturnality can lead to the degradation or loss of opsin genes33,34, it should be a high priority to establish what effect that ancestral nocturnality may have had on the molecular physiology and anatomy of the hummingbird color visual system.
Our attempt to document the color diversity of an avian family has revealed that current estimates of the total avian color gamut are likely inaccurately low. Similar studies sampling from other color-diverse families, such as sunbirds (Nectariniidae), parrots (Psittacidae), tanagers (Thraupidae), birds of paradise (Paradiseidae), manakins (Pipridae), and starlings (Sturnidae), most of which have already been studied for their plumage coloration35,36,37,38,39, would help us obtain a better estimate of the true avian color gamut.
Methods
Plumage color measurement
More than 5000 reflectance spectra were collected from over 1600 plumage patches from 114 different species of hummingbirds (Trochilidae) from study skin specimens from the Yale Peabody Museum (YPM) and the American Museum of Natural History (AMNH) (species and catalog numbers are listed in Supplementary Data 1). The sample included approximately 33% of extant hummingbird species (and 60% of genera). To maximize the estimated hummingbird plumage color gamut, species were selected for unique colors or diverse plumages (as seen by human observers). To represent the diversity of the family, several species were included from each major clade as defined by McGuire et al.19 regardless of coloration. Mostly male specimens were used as they are usually the most colorful sex.
Following Stoddard and Prum2, reflectance spectra were measured from six standardized patches from all specimens: crown, back, tail, wing, belly, and throat. Additional patches were measured if they were distinct to the human eye and large enough to measure reliably. Each plumage patch was measured from a different position three times. Multiple measurements were not averaged to prevent flattening of highly saturated peaks with slightly different hues. If a patch showed a gradient in color, measurements were taken at the ends and center of the gradient.
Reflectance spectra were measured with a S2000 Ocean Optics spectrometer and a bifurcated fiber with an Ocean Optics DH-2000-BAL deuterium–halogen light source (Ocean Optics, Dunedin, FL) in a dark room with an integration time of 100 ms. We did not use a metal block to hold the reflectance probe because it can be difficult to accurately measure plumage reflectance peaks from small iridescent patches at a normal angle of incidence to the plumage surface. Rather, we used a Keysight 3D Probe Positioner (N2787A, KEYSIGHT, Santa Rosa, CA) to hold the optical fiber stable at the appropriate angle of incidence to maximize peak reflectance and saturation while maintaining peak reflectance below 100%.
Each color patch was scored with a presumed color production mechanism, including barbule structural color, melanin (further classified as either eumelanin or phaeomelanin), or white (unpigmented). Color production mechanisms were inferred based on previous literature40, visual appearance, and the shape of the reflectance spectra. Any color that showed barbule structural color as well as melanin was categorized as a barbule structural color. Structural black colors41 were excluded from analyses.
Color space analyses
We modeled avian perception of color using a tetrahedral color space2,6 (Fig. 3) to provide a quantitative representation of avian sensory experience. We used the shareware computer program TetraColorSpace 1.0 (TCS) for MATLAB2,6. The way TCS works was described in Stoddard and Prum (2011)2:
“The idealized stimulus, Q I, of each color cone-type was estimated by the reflectance spectrum of a plumage patch:
$${Q}_{1}={\int}_{\!\!\!300}^{700}R\left(\lambda \right){C}_{r}\left(\lambda \right)d\lambda$$(1)where R(λ) is the reflectance spectrum of the plumage patch and Cr(λ) is the spectral sensitivity function of each cone-type r. R(λ) and Cr(λ) functions were normalized to have integrals of 1. We assumed a standard constant illumination across all visible wavelengths. For each plumage color, the idealized stimulation values of the 4 color cones—Q I—were normalized to sum to one, yielding relative {uv/v s m l} values.
The {uv/v s m l} values of each reflectance spectrum were converted to a color point with spherical coordinates θ, φ, and r, which define a color vector in the tetrahedral color space... This tetrahedral geometry places the achromatic point of equal cone stimulation—white, black, or gray—at the origin and the uv/v vertex along the vertical z-axis… Each color has a hue and saturation. Hue is defined as the direction of the color vector, given by the angles θ and φ, which are analogous to the longitude and latitude, respectively… Saturation, or chroma, is given by the magnitude of r, or its distance from the achromatic origin. Because the color space is a tetrahedron and not a sphere, different hues vary in their potential maximum chroma, or rmax (Stoddard and Prum 2008)6.”
We estimated the total gamut of hummingbird plumage coloration, and gamuts of specific coloration mechanisms, species, and plumage patches by calculating the volume of color space occupied by the minimum convex polygon containing all relevant color points. We used Robinson projections to view the distribution of hues independent of saturation2,5,6.
For the entire hummingbird color sample, each plumage patch type, and each species, we calculated a plumage color volume, the % volume occupied of the total color space, the average and maximum color span (i.e., linear distance between color points), and the average and maximum hue disparity (i.e., difference in color vector angle between color vectors). We calculated color volumes in terms of the % of the achieved color gamut of all birds, both as estimated by Stoddard and Prum2 and by combining their data with our expanded hummingbird data. Lastly, we created tetrahedral plots and Robinson projections for all hummingbirds, for each hummingbird species, for each patch type, for each color production mechanism type, and for our hummingbirds combined with Stoddard and Prum2’s data. Following the methods of Stoddard and Prum2, we also calculated color span, hue disparity, and chroma metrics. Hummingbirds appear to have a violet-sensitive (VS) type color visual system30,42 (but see29,43,44); therefore our results are reported primarily using VS visual system, but all analyses were conducted using both VS and ultraviolet sensitive (UVS) visual system settings for comparison.
The use of convex hull volumes has been criticized as containing unoccupied spaces45 and being sensitive to outliers46. However, we use the convex hull rather than other recently proposed alternatives, such as Delhey 2015’s color space grid45 or Gruson 2020’s α-shapes46, because the convex hull appropriately quantifies the perceivable signal diversity and total contrast achieved by a clade within a sensory space. As proposed by Stoddard and Prum6, the color gamut is a macroevolutionary concept, capturing the achieved sensory diversity of a species or clade. The sensory perception of the organisms themselves, and the capacity for contrast among those perceptions, are central to the intellectual goal of quantifying a color gamut. Because each of the edges of a convex hull is a potentially observable color contrast between color points, each makes a legitimate contribution to the estimate of the volume of color space occupied. The α-shapes method of estimating color space occupancy46 has the additional problem that it cannot establish a standardized α-value for comparing the gamuts based on different heterogeneous samples. Thus, it is not appropriate to the goals of this study.
Statistics and reproducibility
Using the Keysight 3D Probe Positioner (N2787A, KEYSIGHT, Santa Rosa, CA) to help collect plumage color reflectance spectra allowed us to preserve some within patch color variation while also increasing repeatability of spectra from iridescent structural colored patches because it allowed us to find the appropriate angle that produced the most saturated spectra: The most saturated spectra exhibit normal incidence to the laminar nanostructures in the barbules, which may not be normal to the plane of the plumage surface. As a consequence, however, the distance of the optical fiber from the plumage surface could not be standardized, so reflectance spectra are reported in arbitrary units rather than % reflectance. This has no impact on color space analysis, which ignores spectral brightness.
To see how well our sample estimates the total hummingbird plumage color gamut, we resampled using a rarefaction scheme to see how the color gamut increased with the number of species via associated error terms. We resampled datasets of 60, 70, 80, 90, 100, and 110 species without replacement 10 times each (Supplementary Data 1) and calculated the average, standard deviation, and coefficient of variation in plumage color gamut size.
Reporting summary
Further information on research design is available in the Nature Research Reporting Summary linked to this article.
Data availability
The data depicted by the figures and tables are available on Dryad (doi:10.5061/dryad.1c59zw3xn)47. Individual spectrum TXT files for each measurement are also available from the corresponding authors upon reasonable request. Skin specimens were from the Yale Peabody Museum and the American Museum of Natural History (Catalog numbers located in Supplementary Data 1). The data from Stoddard and Prum 20112 are available at https://doi.org/10.1093/beheco/arr088).
Code availability
TetraColorSpace software available online at https://www.marycstoddard.com/software. An R-script used to combine raw spectra data (individual TXT files) to CSV files with the data for each species is also available on Dryad (https://doi.org/10.5061/dryad.1c59zw3xn)47.
References
Cuthill, I. C. et al. The biology of color. Science 357, eaan0221 (2017).
Stoddard, M. C. & Prum, R. O. How colorful are birds? Evolution of the avian plumage color gamut. Behav. Ecol. 22, 1042–1052 (2011).
Sumner, P. & Mollon, J. Colors of primate pelage and skin: objective assessment of conspicuousness. Am. J. Primatology: Off. J. Am. Soc. Primatologists 59, 67–91 (2003).
Hart, N. S. The visual ecology of avian photoreceptors. Prog. Retinal Eye Res. 20, 675–703 (2001).
Endler, J. A. & Mielke, P. W. Jr. Comparing entire colour patterns as birds see them. Biol. J. Linn. Soc. 86, 405–431 (2005).
Stoddard, M. C. & Prum, R. O. Evolution of avian plumage color in a tetrahedral color space: a phylogenetic analysis of new world buntings. Am. Naturalist 171, 755–776 (2008).
Cuthill, I. C. In Bird coloration: Mechanisms and measurements Vol. 1 (ed Hill, G. & McGraw, K.) 3-40 (Harvard University Press, 2006).
Prum, R. O. In Bird coloration: Mechanisms and measurements Vol. 1 (ed Hill, G. & McGraw, K.) 295-353 (Harvard University Press, 2006).
Greenewalt, C. H., Brandt, W. & Friel, D. D. Iridescent colors of hummingbird feathers. JOSA 50, 1005–1013 (1960).
Greenewalt, C. H., Brandt, W. & Friel, D. D. Iridescent colors of hummingbird feathers. Proc. Am. Philos. Soc. 104, 249–253 (1960).
Schmidt, W. & Ruska, H. Über das schillernde Federmelanin bei Heliangelus und Lophophorus. Z. f.ür. Zellforsch. und Mikroskopische Anat. 57, 1–36 (1962).
Eliason, C. M., Maia, R., Parra, J. L. & Shawkey, M. D. Signal evolution and morphological complexity in hummingbirds (Aves: Trochilidae). Evolution 74, 447–458 (2020).
Giraldo, M. A., Parra, J. L. & Stavenga, D. G. Iridescent colouration of male Anna’s hummingbird (Calypte anna) caused by multilayered barbules. J. Comp. Physiol. A 204, 965–975 (2018).
Beltrán, D. F., Shultz, A. J. & Parra, J. L. Speciation rates are positively correlated with the rate of plumage color evolution in hummingbirds. Evolution 75, 1665–1680 (2021).
Bleiweiss, R. Behavioural and evolutionary implications of ultraviolet reflectance by gorgets of sunangel hummingbirds. Anim. Behav. 48, 978–981 (1994).
Hogan, B. G. & Stoddard, M. C. Synchronization of speed, sound and iridescent color in a hummingbird aerial courtship dive. Nat. Commun. 9, 1–8 (2018).
Parra, J. L. Color evolution in the hummingbird genus. Evolution 64, 324–335 (2010).
Maia, R., Rubenstein, D. R. & Shawkey, M. D. Key ornamental innovations facilitate diversification in an avian radiation. Proc. Natl Acad. Sci. 110, 10687–10692 (2013).
McGuire, J. A. et al. Molecular phylogenetics and the diversification of hummingbirds. Curr. Biol. 24, 910–916 (2014).
Clark, C. J., McGuire, J. A., Bonaccorso, E., Berv, J. S. & Prum, R. O. Complex coevolution of wing, tail, and vocal sounds of courting male bee hummingbirds. Evolution 72, 630–646 (2018).
Bleiweiss, R. Iridescent polychromatism in a female hummingbird: is it related to feeding strategies? Auk 102, 701–713 (1985).
Eliason, C. M., Maia, R. & Shawkey, M. D. Modular color evolution facilitated by a complex nanostructure in birds. Evolution 69, 357–367 (2015).
Eliason, C. M., Bitton, P.-P. & Shawkey, M. D. How hollow melanosomes affect iridescent colour production in birds. Proc. R. Soc. B: Biol. Sci. 280, 20131505 (2013).
Stavenga, D. G., Leertouwer, H. L., Osorio, D. C. & Wilts, B. D. High refractive index of melanin in shiny occipital feathers of a bird of paradise. Light.: Sci. Appl. 4, e243–e243 (2015).
Land, M. F. The physics and biology of animal reflectors. Prog. Biophysics Mol. Biol. 24, 75–106 (1972).
Martin Schaefer, H., Schaefer, V. & Vorobyev, M. Are fruit colors adapted to consumer vision and birds equally efficient in detecting colorful signals? Am. Naturalist 169, S159–S169 (2007).
Osorio, D. & Vorobyev, M. A review of the evolution of animal colour vision and visual communication signals. Vis. Res. 48, 2042–2051 (2008).
Goldsmith, T. H. Hummingbirds see near ultraviolet light. Science 207, 786–788 (1980).
Herrera, G. et al. Spectral sensitivities of photoreceptors and their role in colour discrimination in the green-backed firecrown hummingbird (Sephanoides sephaniodes). J. Comp. Physiol. A 194, 785 (2008).
Stoddard, M. C. et al. Wild hummingbirds discriminate nonspectral colors. Proc. Natl Acad. Sci. 117, 15112–15122 (2020).
Prum, R. O. et al. A comprehensive phylogeny of birds (Aves) using targeted next-generation DNA sequencing. Nature 526, 569–573 (2015).
White, N. D. & Braun, M. J. Extracting phylogenetic signal from phylogenomic data: Higher-level relationships of the nightbirds (Strisores). Mol. Phylogenetics evolution 141, 106611 (2019).
Le Duc, D. et al. Kiwi genome provides insights into evolution of a nocturnal lifestyle. Genome Biol. 16, 147 (2015).
Zhao, H. et al. The evolution of color vision in nocturnal mammals. Proc. Natl Acad. Sci. 106, 8980–8985 (2009).
Price-Waldman, R. M., Shultz, A. J. & Burns, K. J. Speciation rates are correlated with changes in plumage color complexity in the largest family of songbirds. Evolution 74, 1155–1169, (2020).
Shawkey, M. D. et al. Beyond colour: consistent variation in near infrared and solar reflectivity in sunbirds (Nectariniidae). Sci. Nat. 104, 78 (2017).
Merwin, J. T., Seeholzer, G. F. & Smith, B. T. Macroevolutionary bursts and constraints generate a rainbow in a clade of tropical birds. BMC Evolut. Biol. 20, 32, https://doi.org/10.1186/s12862-020-1577-y (2020).
Ligon, R. A. et al. Evolution of correlated complexity in the radically different courtship signals of birds-of-paradise. PLOS Biol. 16, e2006962 (2018).
Doucet, S. M., Mennill, D. J. & Hill, G. E. The evolution of signal design in manakin plumage ornaments. Am. Naturalist 169, S62–S80 (2007).
Hill, G. E. & McGraw, K. J. Bird coloration: mechanisms and measurements. Vol. 1 (Harvard University Press, 2006).
McCoy, D. E. & Prum, R. O. Convergent evolution of super black plumage near bright color in 15 bird families. J. Exp. Biol. 222, jeb208140 (2019).
Ödeen, A. & Håstad, O. Pollinating birds differ in spectral sensitivity. J. Comp. Physiol. A 196, 91–96 (2010).
Chen, D. M. & Goldsmith, T. H. Four spectral classes of cone in the retinas of birds. J. Comp. Physiol. A 159, 473–479 (1986).
Chen, D. M., Collins, J. S. & Goldsmith, T. H. The ultraviolet receptor if bird retinas. Science 225, 337–340 (1984).
Delhey, K. The colour of an avifauna: A quantitative analysis of the colour of Australian birds. Sci. Rep. 5, 18514 (2015).
Gruson, H. Estimation of colour volumes as concave hypervolumes using α-shapes. Methods Ecol. Evolution 11, 955–963, (2020).
Venable, G. X., Gahm, K. & Prum, R. O. Hummingbird plumage color diversity exceeds the gamut of all other birds datasets. Dryad, https://doi.org/10.5061/dryad.1c59zw3xn (2022)
Acknowledgements
This work was completed in fulfillment of the undergraduate thesis requirement for E&EB at Yale University by GXV. We thank the Yale Peabody Museum of Natural History (YPM), and the American Museum of Natural History (AMNH) for permission to measure specimens in their care, especially Kristof Zyskowski and Bentley Bird. David Heiser and Dave Evans provided advice to GXV on funding. Glenn Bartley, Wilmer Quiceno, and John Cahill kindly gave permission for us to reproduce their lovely photographs (Fig. 1). The research was supported by a Yale Peabody Museum Summer Internship Fellowship and the Yale Berkeley College Max and Reba E. Richter Scholarship and Robert Berlin Fellowship to G.X.V., and the Yale William Robertson Coe Fund to R.O.P.
Author information
Authors and Affiliations
Contributions
G.X.V. and R.O.P. formulated the questions and wrote the paper; G.X.V. collected and analyzed the data; K.G. created the R-script necessary to analyze the data; R.O.P. supervised research.
Corresponding authors
Ethics declarations
Competing interests
The authors declare no competing interests.
Peer review
Peer review information
Communications Biology thanks the anonymous reviewers for their contribution to the peer review of this work. Primary Handling Editor: Caitlin Karniski.
Additional information
Publisher’s note Springer Nature remains neutral with regard to jurisdictional claims in published maps and institutional affiliations.
Rights and permissions
Open Access This article is licensed under a Creative Commons Attribution 4.0 International License, which permits use, sharing, adaptation, distribution and reproduction in any medium or format, as long as you give appropriate credit to the original author(s) and the source, provide a link to the Creative Commons license, and indicate if changes were made. The images or other third party material in this article are included in the article’s Creative Commons license, unless indicated otherwise in a credit line to the material. If material is not included in the article’s Creative Commons license and your intended use is not permitted by statutory regulation or exceeds the permitted use, you will need to obtain permission directly from the copyright holder. To view a copy of this license, visit http://creativecommons.org/licenses/by/4.0/.
About this article

Cite this article
Venable, G.X., Gahm, K. & Prum, R.O. Hummingbird plumage color diversity exceeds the known gamut of all other birds. Commun Biol 5, 576 (2022). https://doi.org/10.1038/s42003-022-03518-2
Received:
Accepted:
Published:
DOI: https://doi.org/10.1038/s42003-022-03518-2
Comments
By submitting a comment you agree to abide by our Terms and Community Guidelines. If you find something abusive or that does not comply with our terms or guidelines please flag it as inappropriate.
