This work has been significantly updated and released as a preprint: https://www.medrxiv.org/content/10.1101/2020.10.23.20218446v1
Preliminary analysis of SARS-CoV-2 importation & establishment of UK transmission lineages
8th June 2020
Oliver Pybus1 & Andrew Rambaut2 with Louis du Plessis1, Alexander E Zarebski1, Moritz U G Kraemer1, Jayna Raghwani1, Bernardo Gutiérrez1, Verity Hill2, John McCrone2, Rachel Colquhoun2, Ben Jackson2, Áine O’Toole2, Jordan Ashworth2, on behalf of the COG-UK consortium3
1 University of Oxford, 2 University of Edinburgh, 3 https://www.cogconsortium.uk
PDF version: ImportAnalysis.pdf (1.3 MB)
The COVID-19 pandemic was first reported in China and has spread rapidly, causing epidemics around the world. Cases of SARS-CoV-2 infections in the United Kingdom (UK) are the result of virus introductions from other countries, followed by local transmission within the UK1. Here we provide estimates of trends through time in the number and sources of SARS-CoV-2 introductions into the UK. We obtain these estimates by combining data on the numbers of inbound travellers to the UK, estimated numbers of infections worldwide, and large-scale virus genome sequencing undertaken by the COG-UK consortium. Our preliminary analysis provides a platform for evaluating future trends in virus introduction, however it does not attempt to measure the relative contributions to the UK epidemic of importation versus local transmission, nor model the possible impact of public health interventions on virus introduction.
The key conclusions of our analysis are as follows:
-
The UK epidemic comprises a very large number of importations due to inbound international travel2. We detect 1356 independently-introduced transmission lineages, however, we expect this number to be an under-estimate.
-
The speed of detection of UK transmission lineages via genome sequencing has increased through time.
-
Many UK transmission lineages now appear to be very rare or extinct, as they have not been detected by genome sequencing for >4 weeks.
-
The rate and source of introduction of SARS-CoV-2 lineages into the UK changed substantially and rapidly through time. The rate peaked in mid-March and most introductions occurred during March 2020.
-
We estimate that ≈34% of detected UK transmission lineages arrived via inbound travel from Spain, ≈29% from France, ≈14% from Italy, and ≈23% from other countries. The relative contributions of these locations were highly dynamic.
-
The increasing rates and shifting source locations of SARS-CoV-2 importation were not fully captured by early contact tracing.
-
Our results are preliminary and further analyses of these data are ongoing.
The COG-UK consortium has to date generated >20,000 SARS-CoV-2 genome sequences from infections in the UK. Phylogenetic analysis of these genomes, and those from other countries, can be used to identify individual UK transmission lineages.
Here we define a “UK transmission lineage” as two or more UK infection cases that (i) descend from a shared, single introduction of the virus into the UK from elsewhere, (ii) are the result of subsequent local transmission within the UK, and (iii) were present in our virus genome sequence dataset (Fig. 1). These lineages can be identified by reconstructing evolutionary trees (phylogenies) of the global pandemic from virus genome sequences sampled worldwide. Note that this concept is distinct to a transmission cluster, which in epidemiology commonly refers to a group of cases that occur close to each other in space and time (e.g. in a hospital or care home). Therefore a large UK transmission lineage may comprise many different individual transmission clusters.
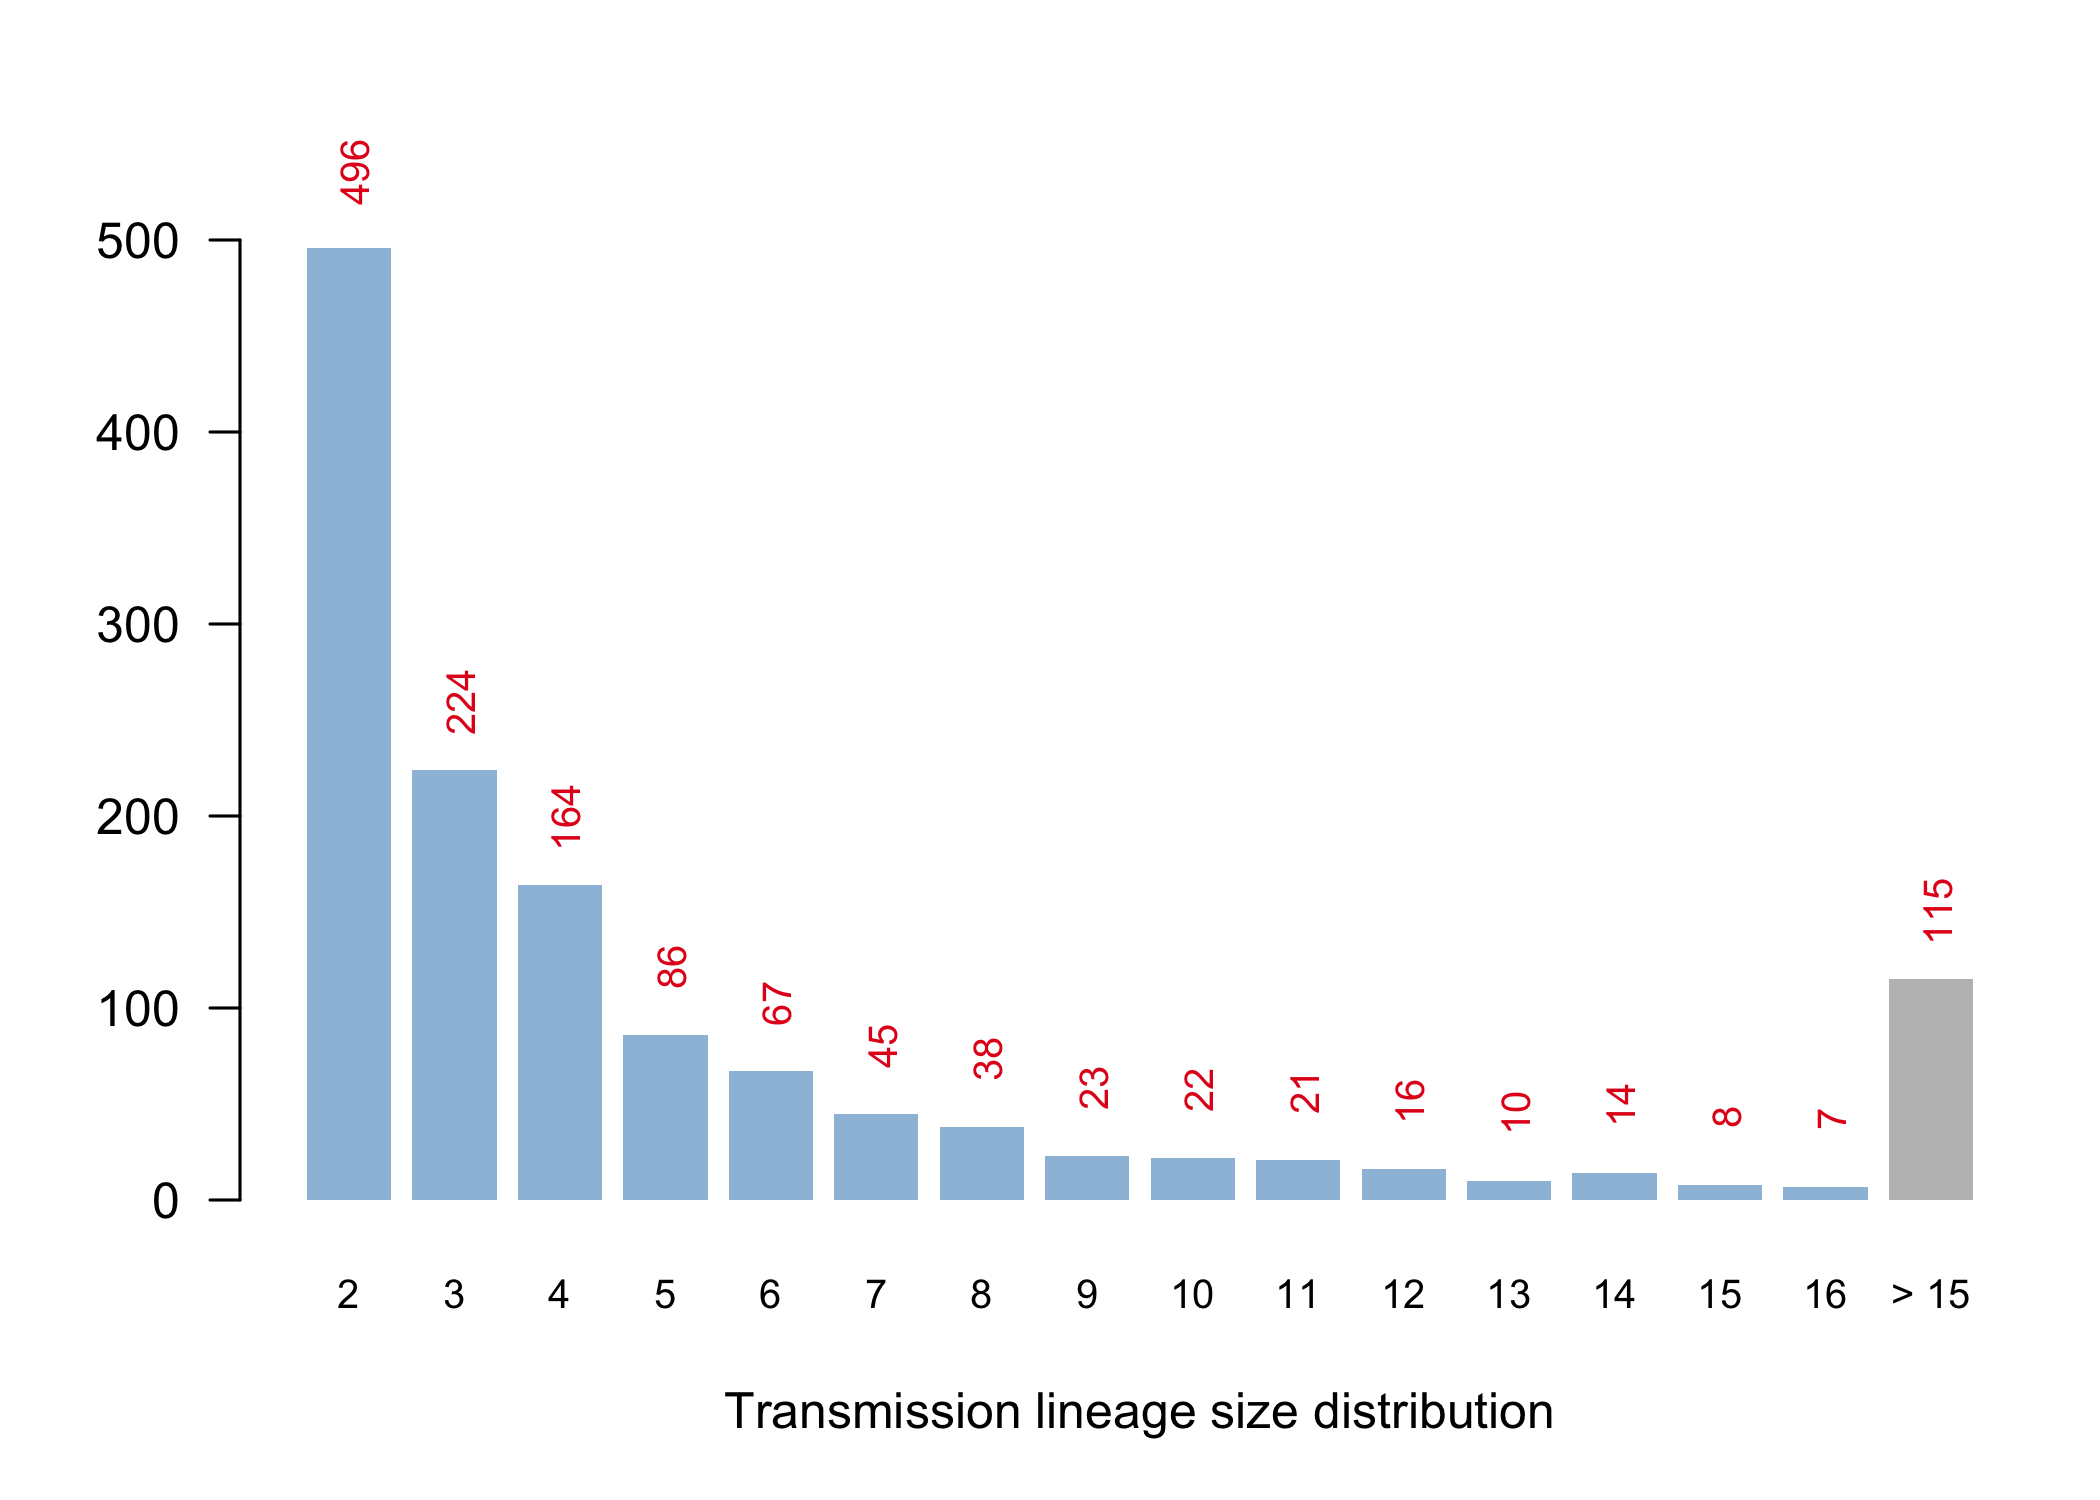
We have detected 1356 transmission lineages in the UK to date3. For methodological reasons4 this is likely to be an underestimate of the actual number of times the virus has been introduced to the UK with subsequent onwards transmission. Appendix 1 provides an illustration of the largest lineages in our data set. The size distribution of UK transmission lineages is provided in Appendix 2.
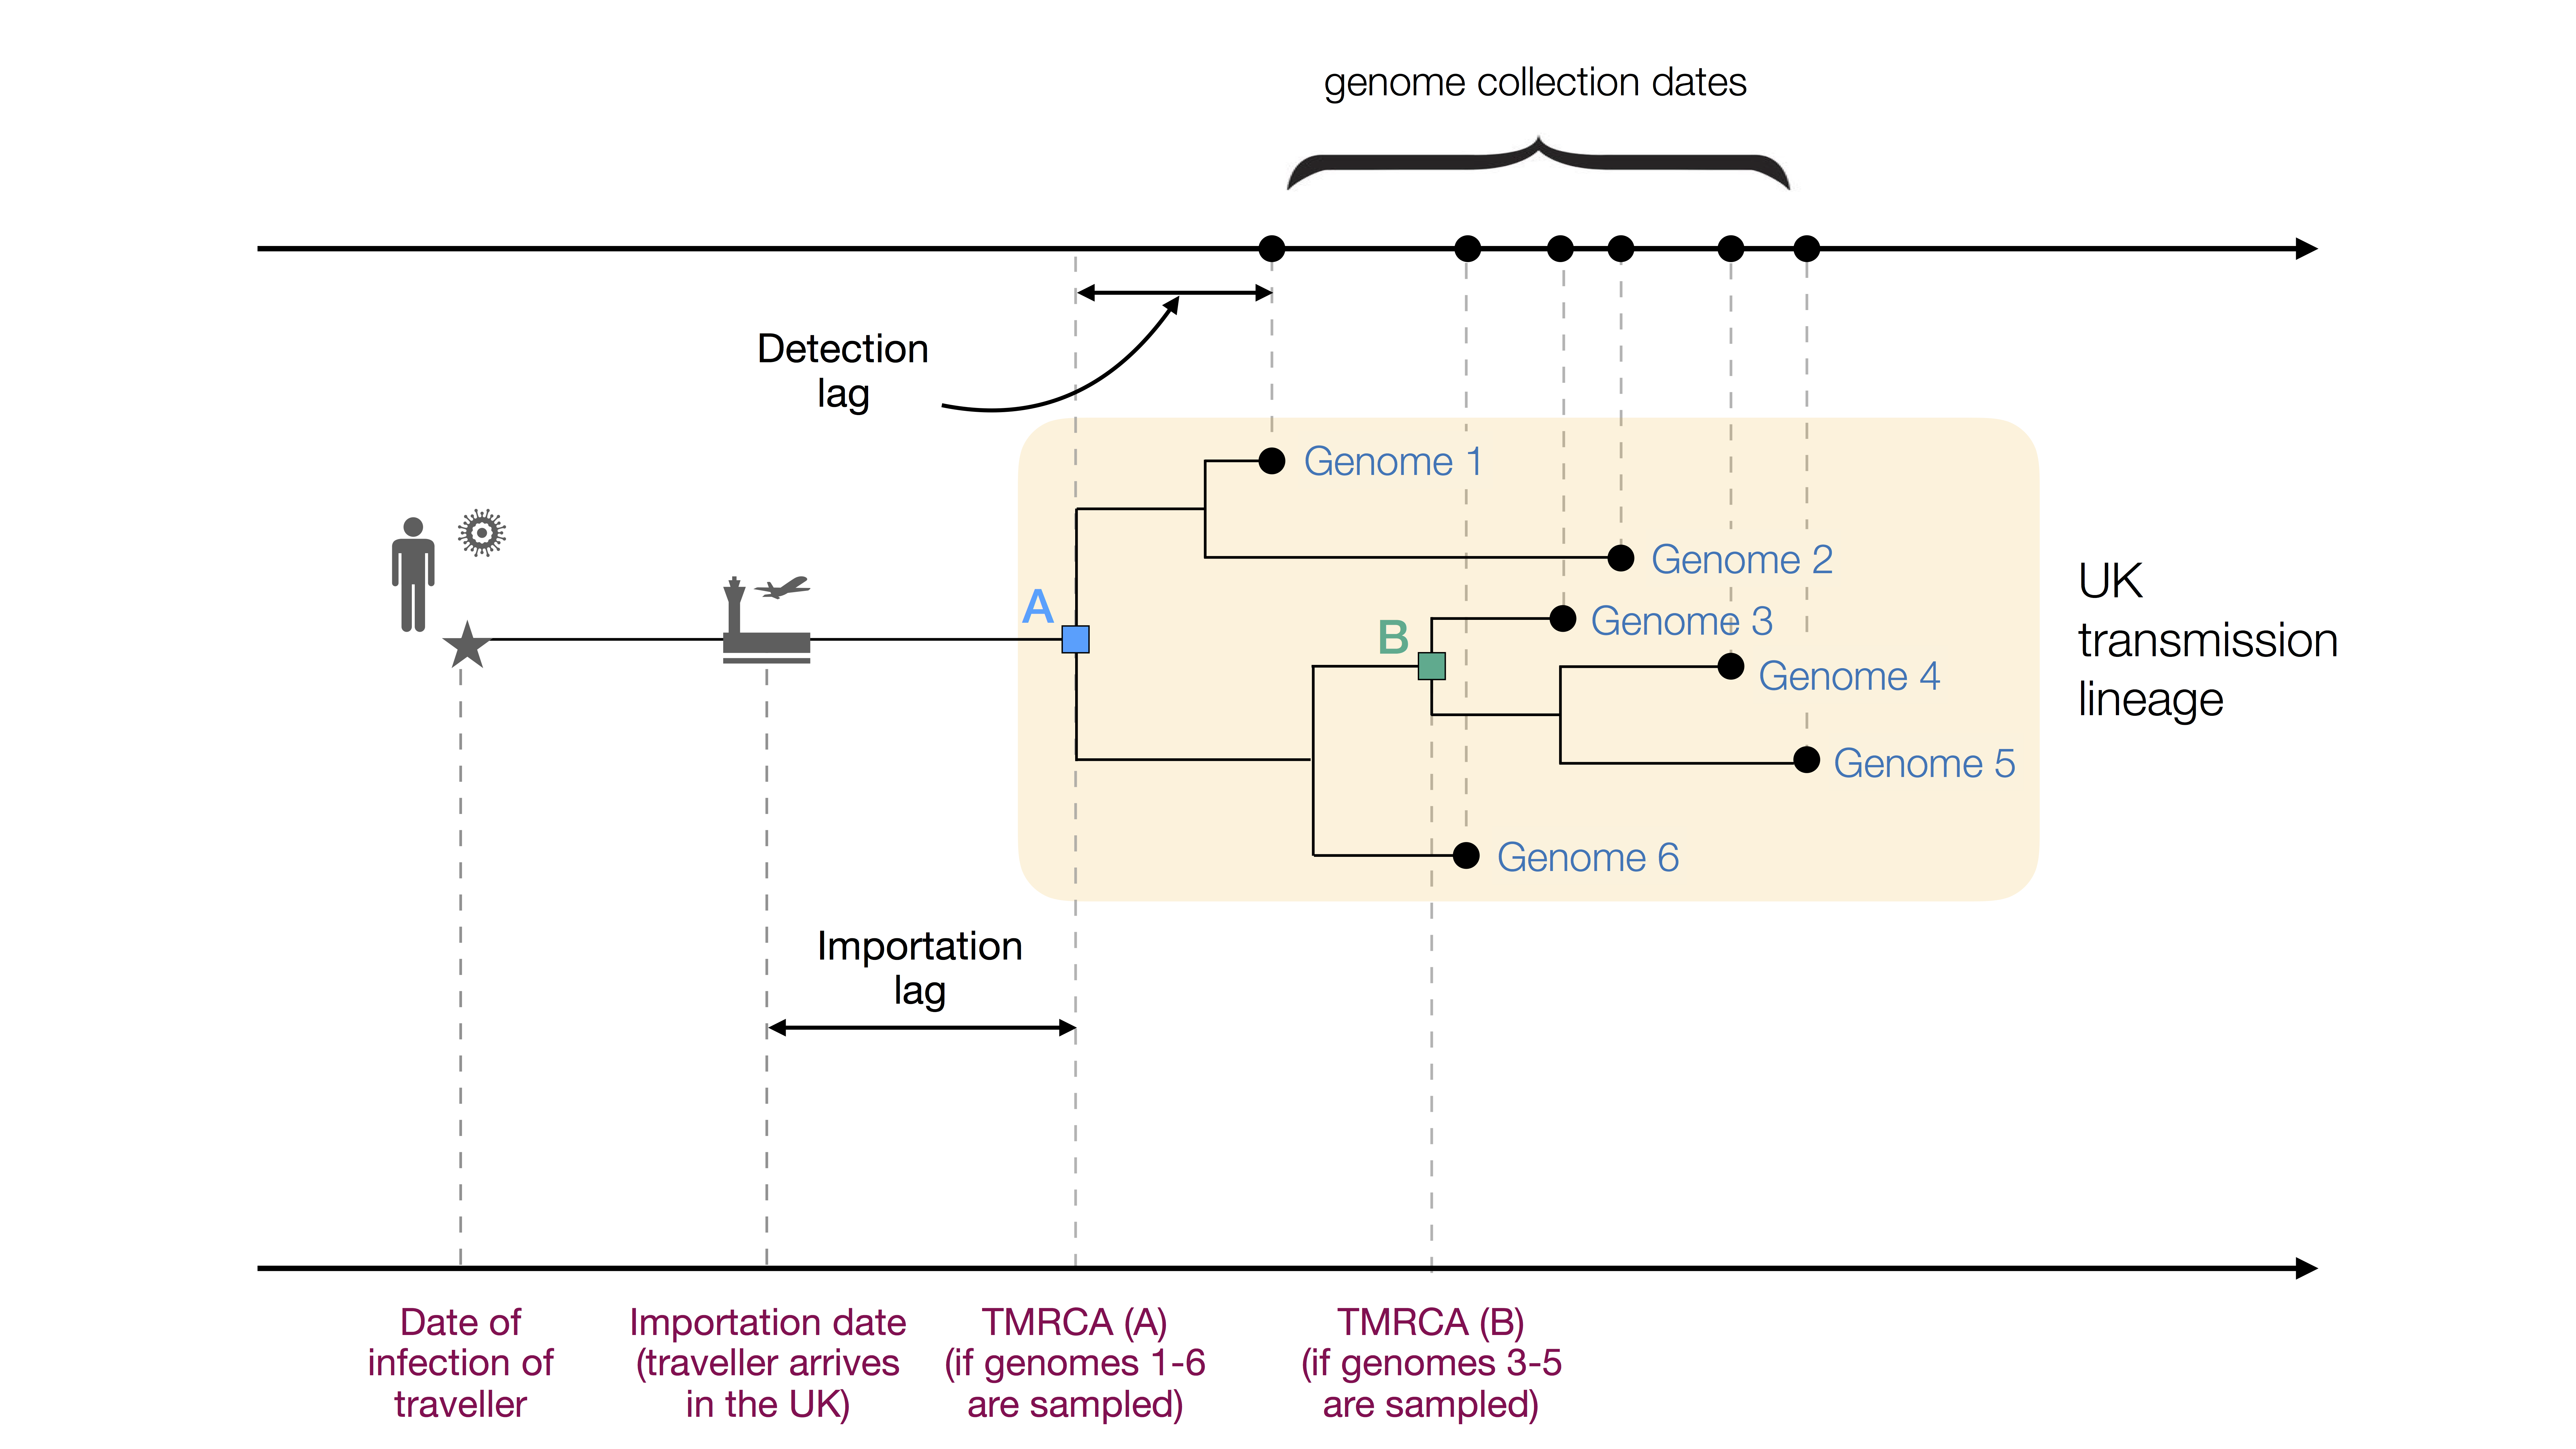
Figure 1: Figurative illustration of a UK transmission lineage detected through genome sampling. To be detected, a UK transmission lineage must contain two or more sampled genomes. The terms TMRCA, detection lag, and importation lag can be understood with reference to this figure. TMRCA A is observed if genomes 1–6 are sampled and TMRCA B is observed if genomes 3–5 are sampled.
We combined genetic differences among the sampled virus genomes with a model of virus evolution to estimate the TMRCA (time of the most recent common ancestor) of each detected UK transmission lineage. The TMRCA is the date of the common ancestor of the sampled genomes in a transmission lineage (Fig. 1). While the TMRCA represents the earliest transmission event in the lineage revealed by the data, it does not necessarily represent the first transmission event in the lineage as a whole. Specifically, if the transmission lineage is well sampled then the TMRCA represents the date of the first transmission event in the UK lineage (TMRCA A in Fig. 1). However, if the transmission lineage is poorly sampled then the TMRCA may represent a later transmission event in the lineage (TMRCA B in Fig. 1). The “importation date” of each UK transmission lineage is the date that an infectious inbound traveller entered the UK. Figure 1 illustrates these and other terms used in this report.
The TMRCAs of the majority of UK transmission lineages are dated to mid-to-late March (Fig. 2; median=25th March, interquartile range = 17th March-1st April). It is important to note that these times represent the date of the first detected transmission event in each lineage, not the virus importation date (see Fig. 1). This distinction is explored further below.
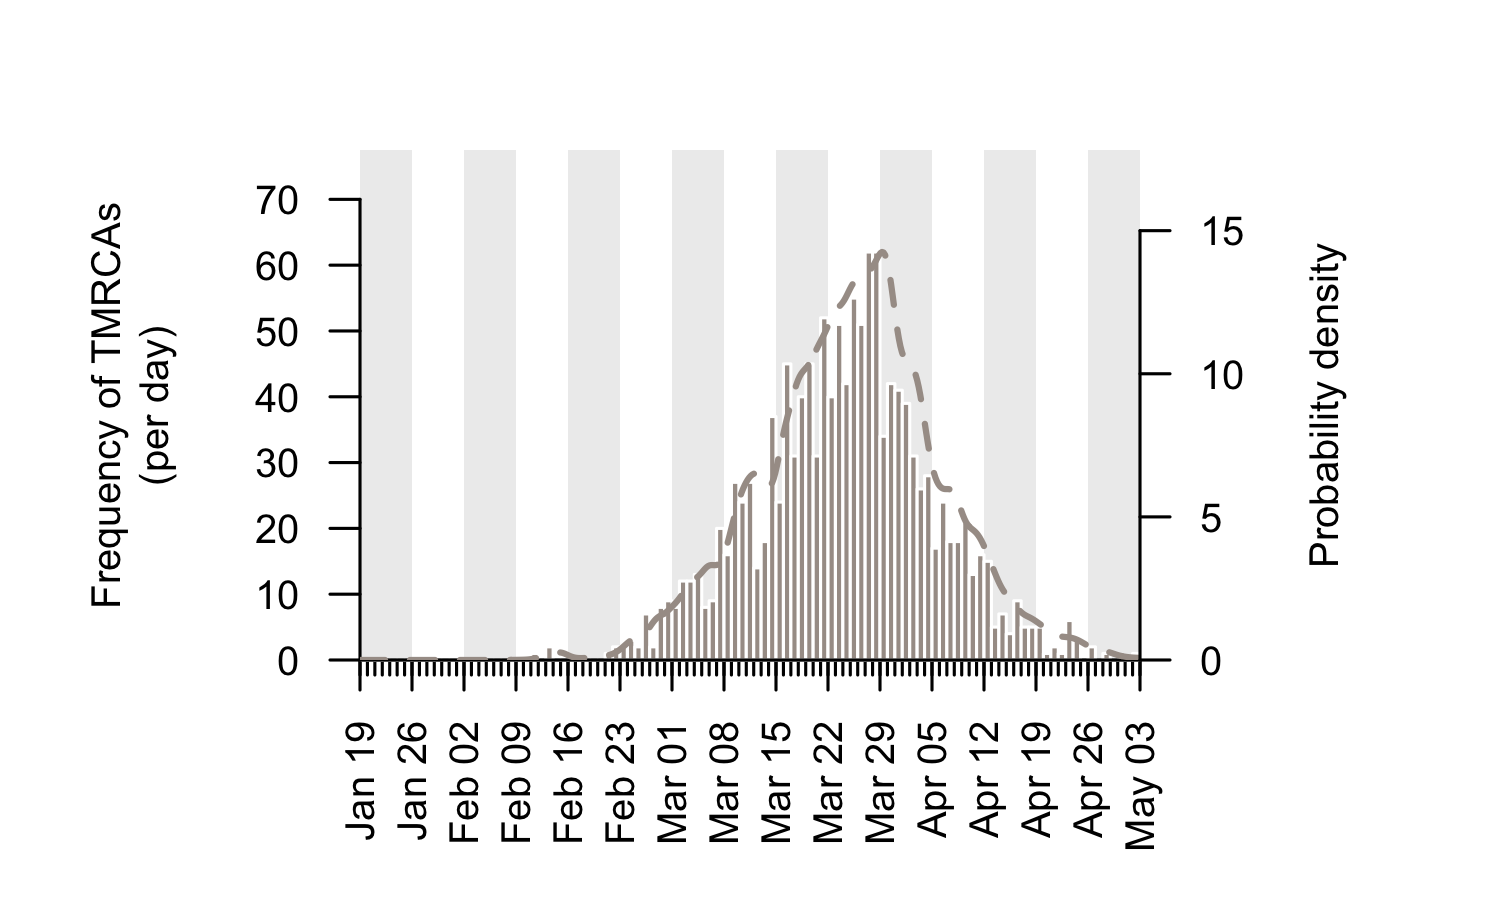
Figure 2: Estimated TMRCAs of detected UK transmission lineages (histogram; left hand axis). These dates are concentrated in mid-to-late March. The bars show the histogram for the median TMRCA of each lineage. The dotted line shows the corresponding probability density of TMRCA estimates after incorporating some aspects of phylogenetic uncertainty (right hand axis).
We can use the TMRCA values to estimate the genomic “detection lag” for each UK transmission lineage, which represents the length of time that a transmission lineage went undetected before it was first sampled by genome sequencing (see Figure 1 for explanation). This detection lag has decreased through time as the cumulative number of UK virus genomes generated by the COG-UK project has increased (Fig. 3).
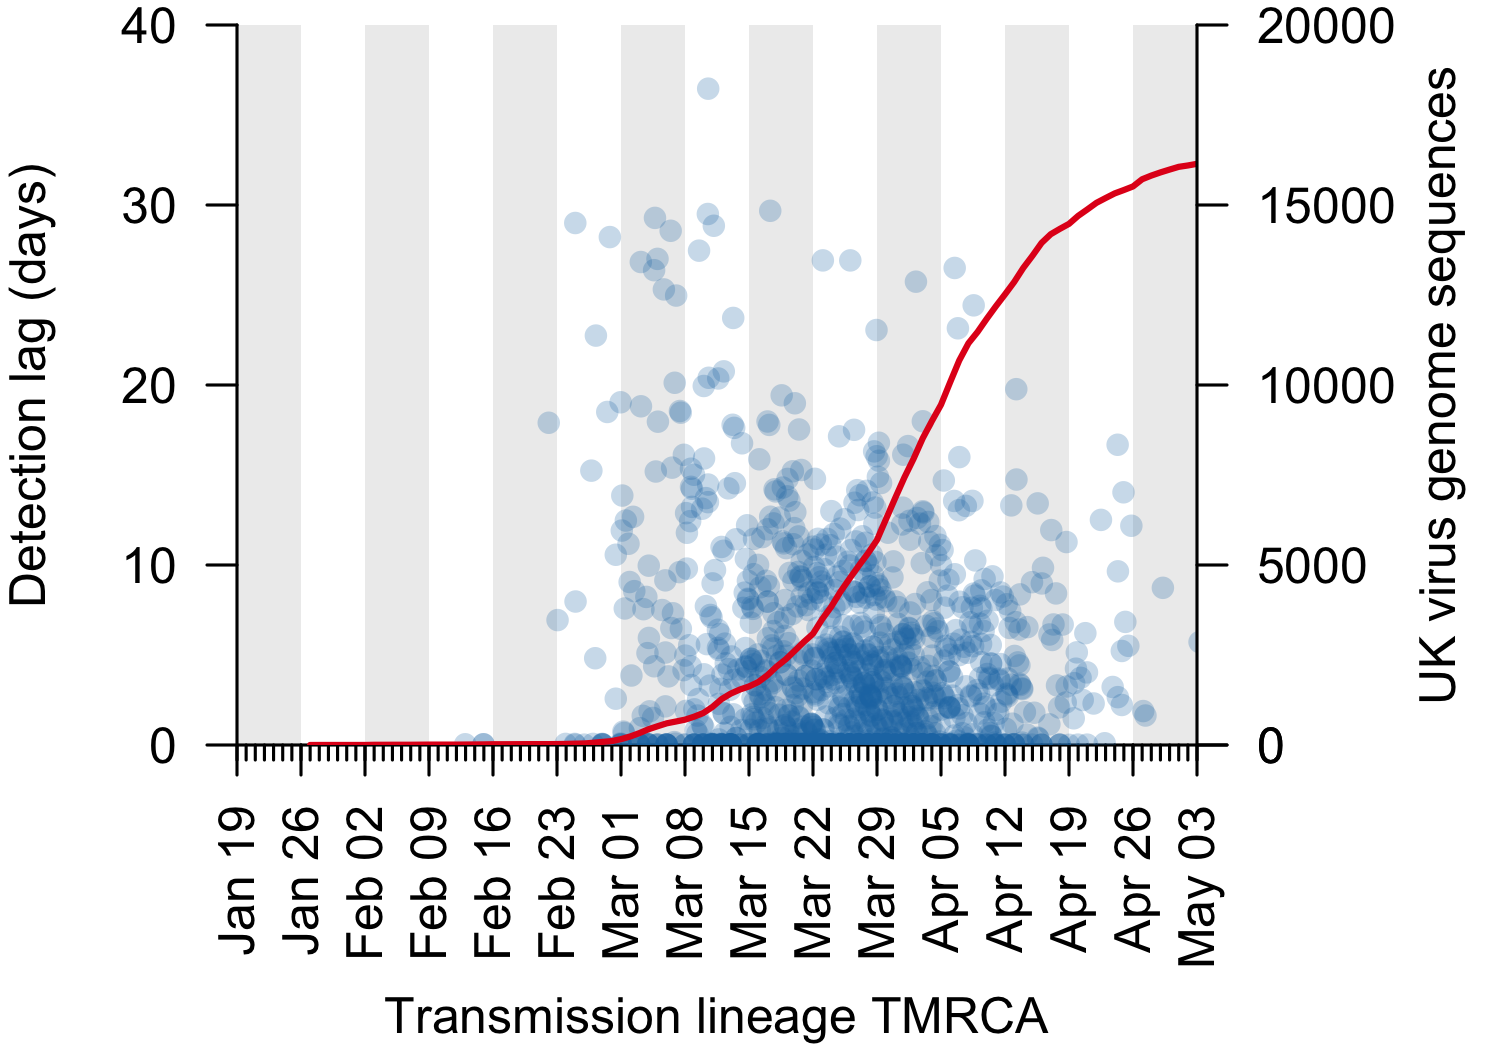
Figure 3: The genomic detection lag has decreased through time (blue points, Pearson correlation coefficient, r=-0.12), coincident with the accumulation of sampled UK virus genomes (red line).
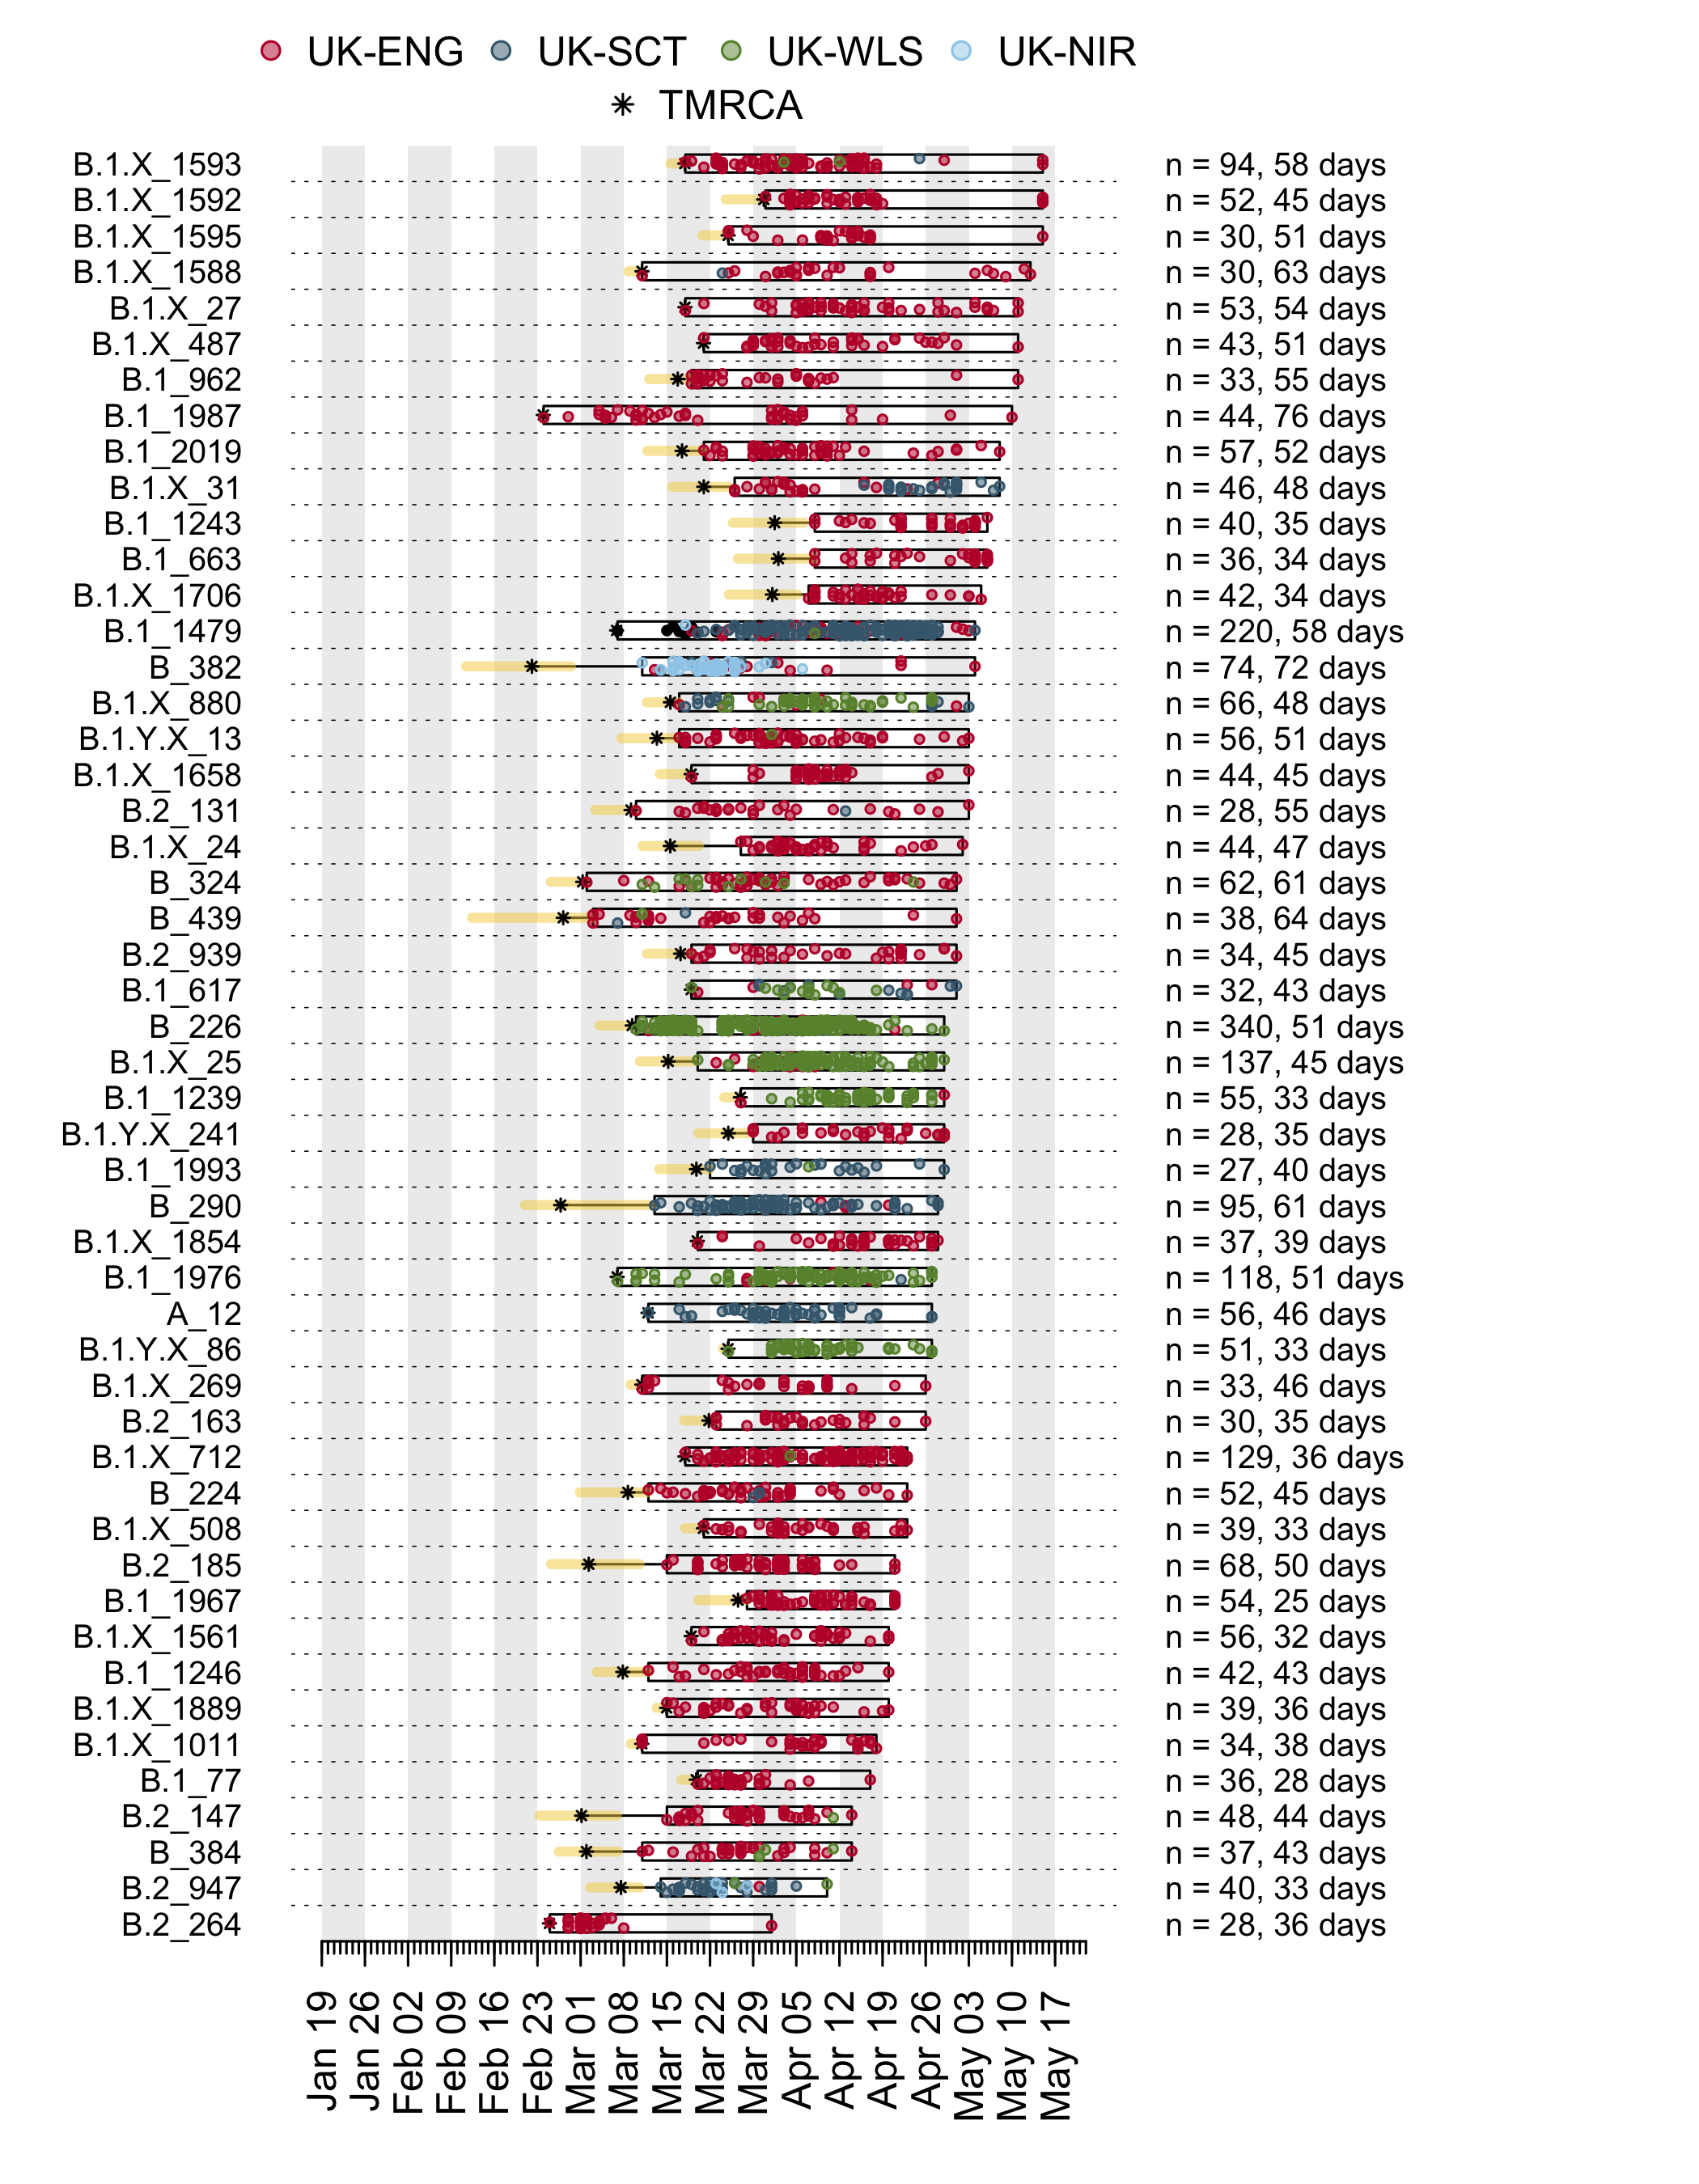
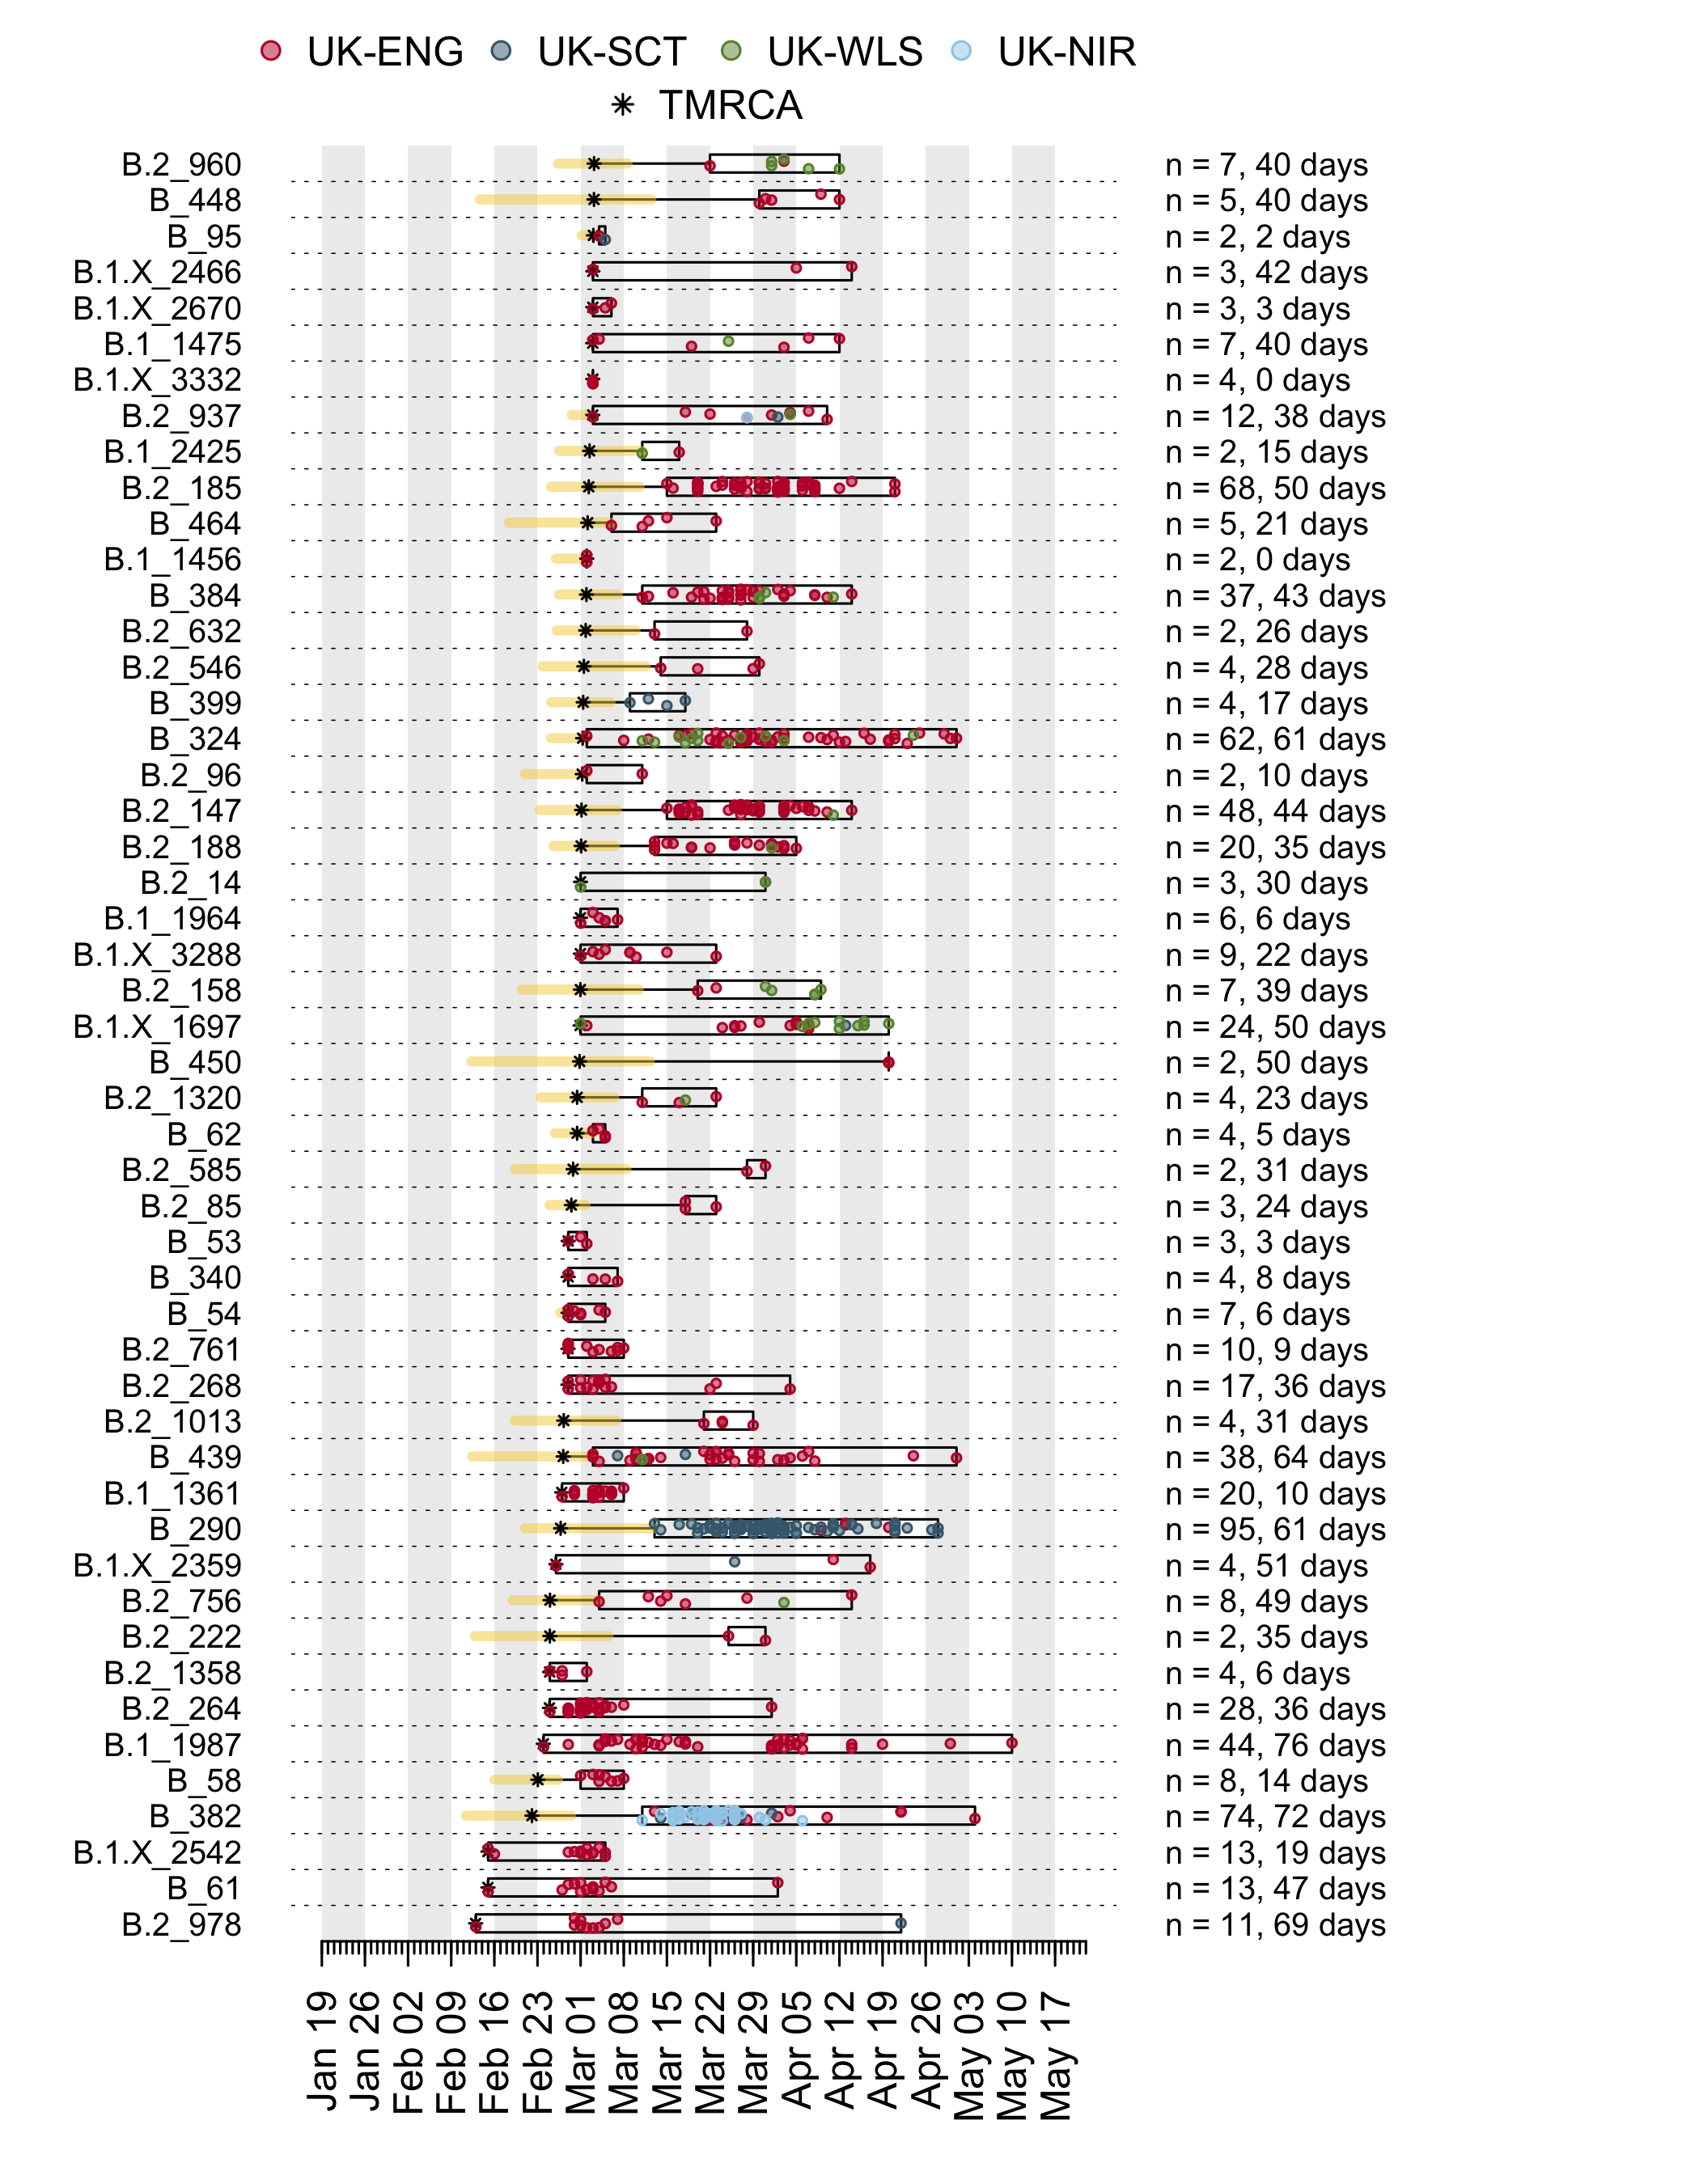
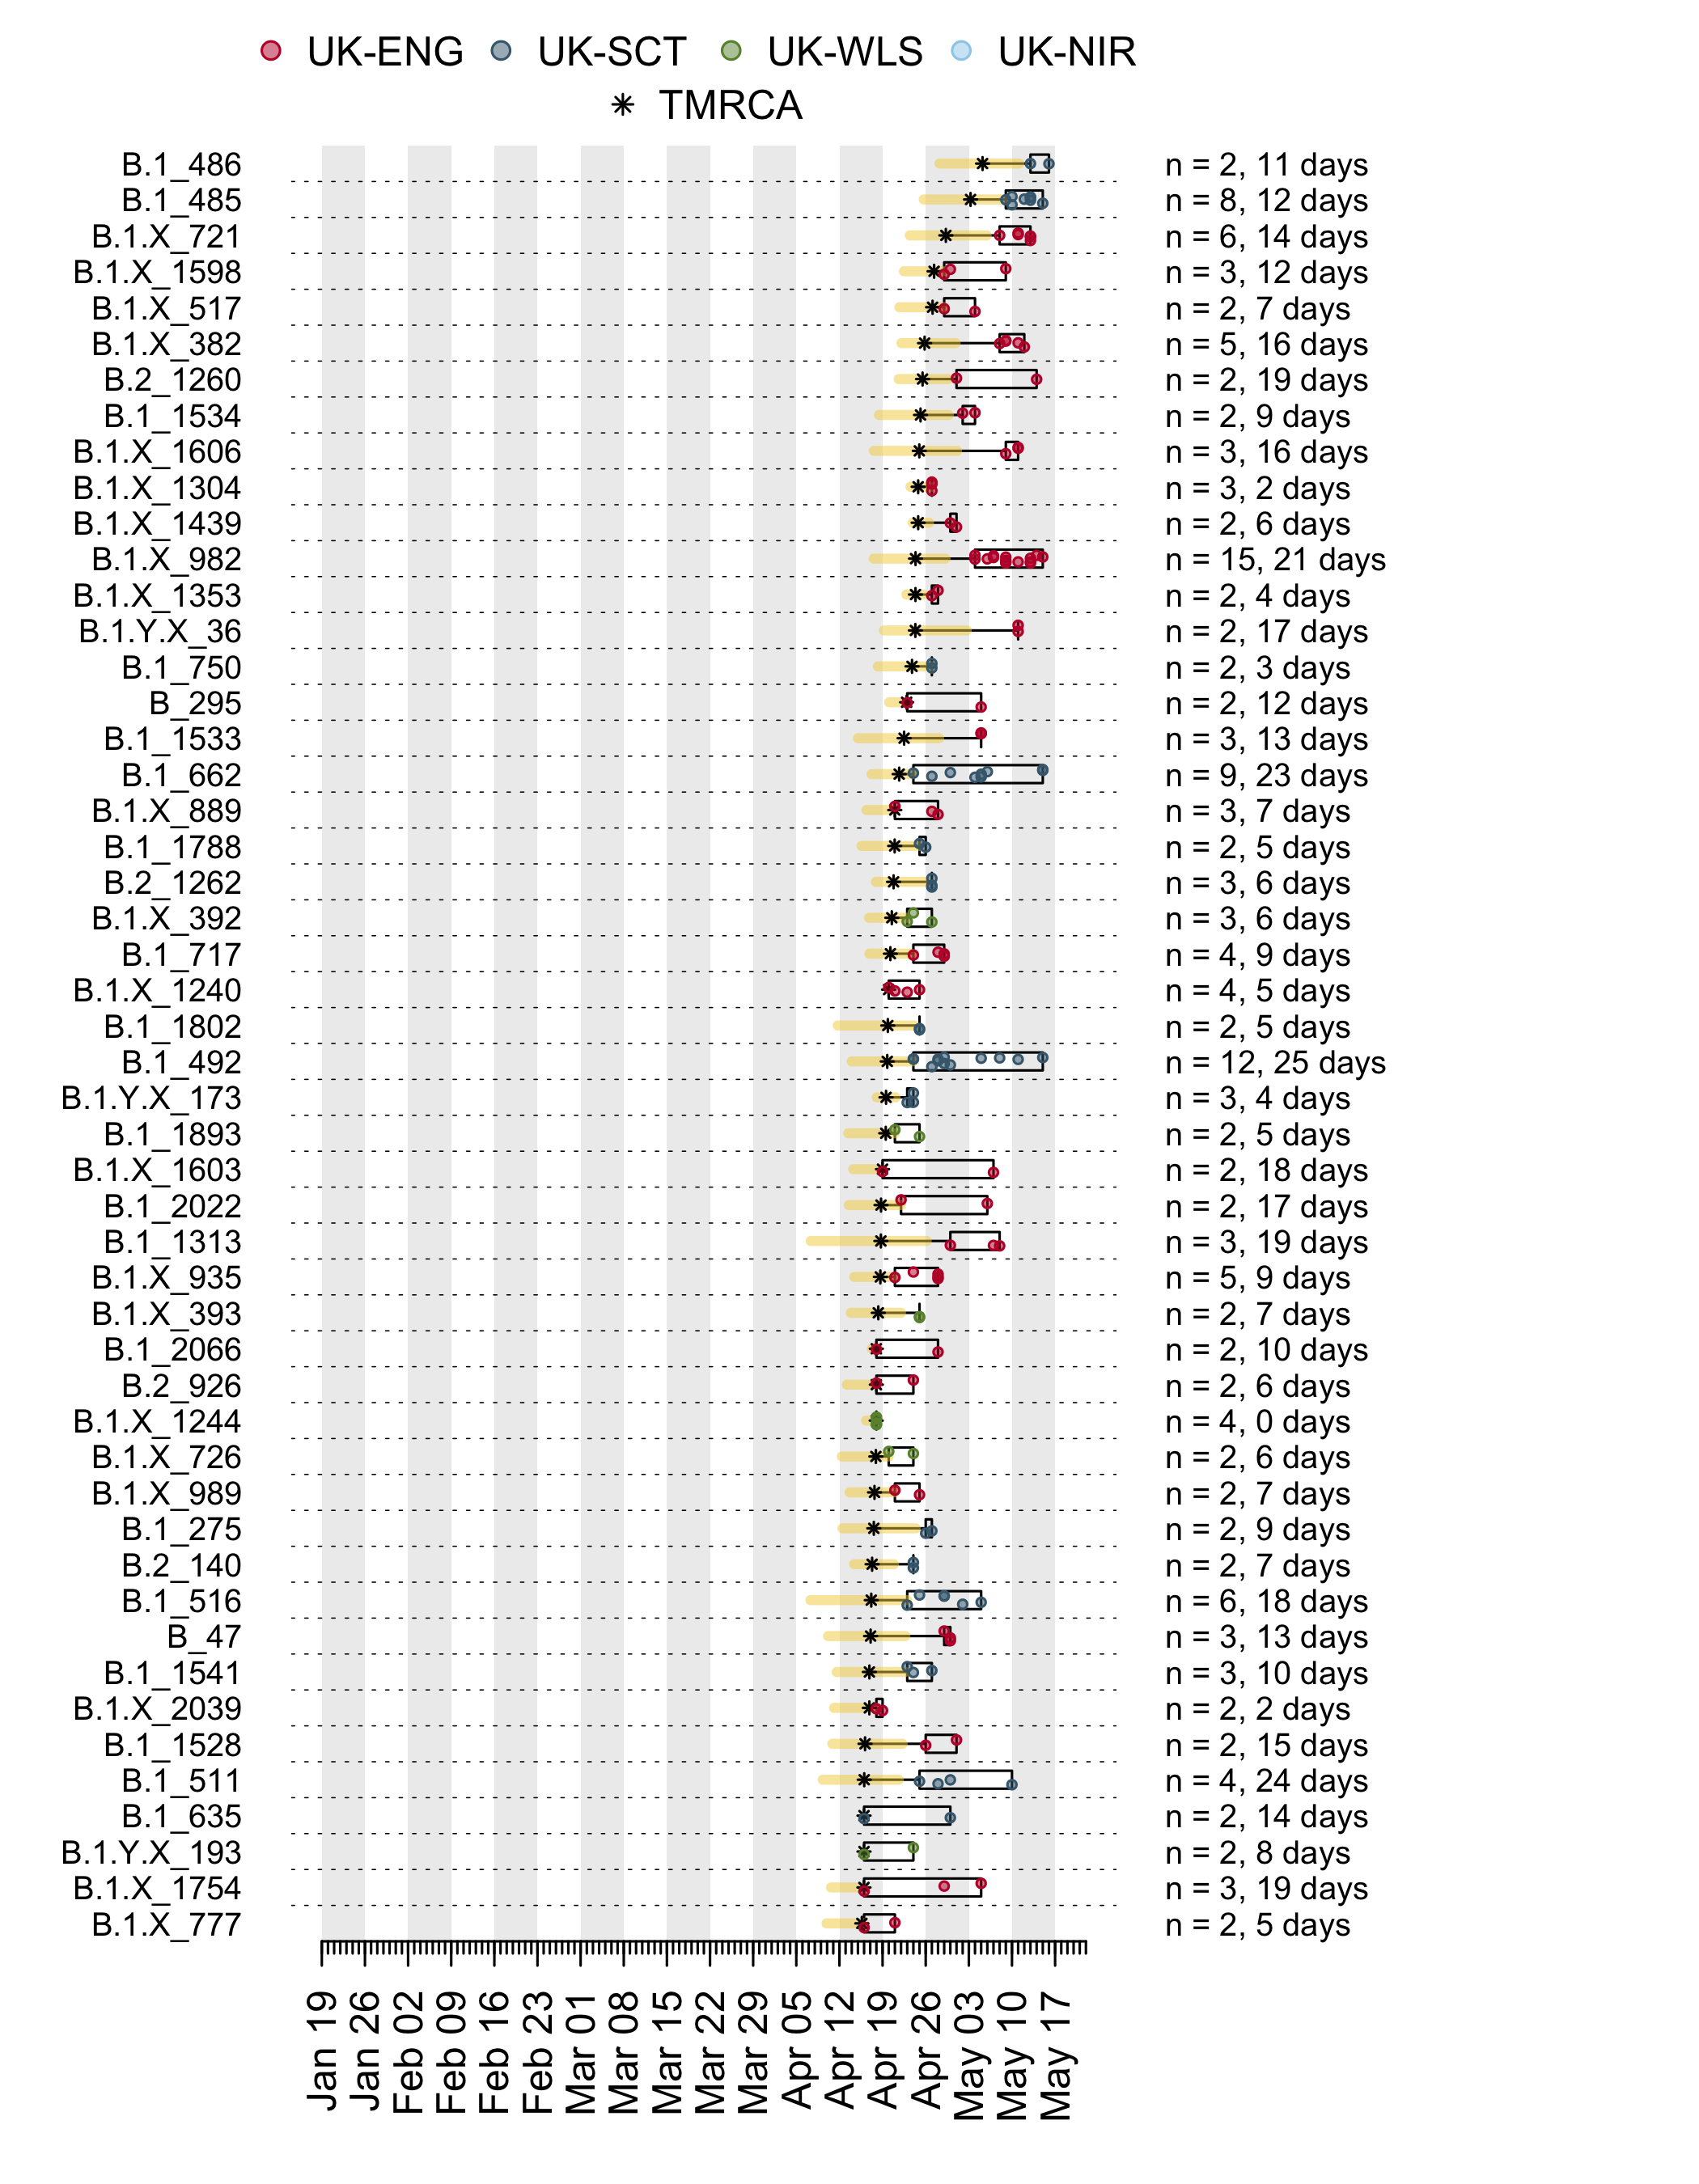
In addition to having different dates of establishment (TMRCAs), UK transmission lineages vary in duration. Many have not been sampled for several weeks and are therefore very rare or gone extinct, most likely as a result of the interventions such as social distancing that led to reductions in the numbers of new cases. Fig. 4 shows how the composition of UK transmission lineages has changed through time. In early March the epidemic mostly comprised lineages that had been newly-detected for the first time, whilst by late April most transmission lineages had not been detected by genomic sampling for more than a week (see Appendix 1).

Figure 4: Trends through time in the detection of UK transmission lineages. The dotted line shows the cumulative number of detected lineages. For each day, all lineages detected up to that day were grouped into four categories (colours) depending on when genomes in that lineage were first, or most recently, sampled.
To understand the delay between importation and subsequent onward transmission within the UK, we quantified the dynamics of virus importation by combining data on the number of inbound travellers into the UK with estimates of SARS-CoV-2 cases worldwide. Figure 5 shows how the number of inbound travellers and global SARS-CoV-2 prevalence changed through time. Until the beginning of March, the UK received ≈1.75m inbound travellers per week. This baseline increases by ≈10% at the end of the February half-term school holidays and varies predictably according to the day of the week. The number of inbound passengers fell rapidly and continuously after 8th March, leading to a ≈95% reduction in inward international travel by the beginning of April that has been maintained. The UK government advised against all non-essential overseas travel on 17th March and advised British travellers overseas to return to the UK on 23rd March. The estimated global prevalence of SARS-CoV-2 rose rapidly in March. Notably there was a period in mid-March when inbound travel to the UK was still substantial and coincided with high numbers of active cases elsewhere.

Figure 5: Estimated total number of inbound travellers to UK per day (black line) and the estimated number of infectious cases worldwide (dashed red line).
We combine the trends shown in Figure 5 to generate an empirical estimate of the daily intensity of SARS-CoV-2 importation into the UK (Fig. 6). This estimated importation intensity (EII) to the UK rises rapidly in early March, peaks around 15th March, then quickly declines to a low level in April.
The temporal profile of the EII closely matches, but precedes, that of the TMRCAs of UK transmission lineages (Fig. 6). The difference between the two curves represents the time elapsed between a virus importation and the first observation of UK transmission in the lineage that results from that importation (denoted “importation lag” in Figure 1).
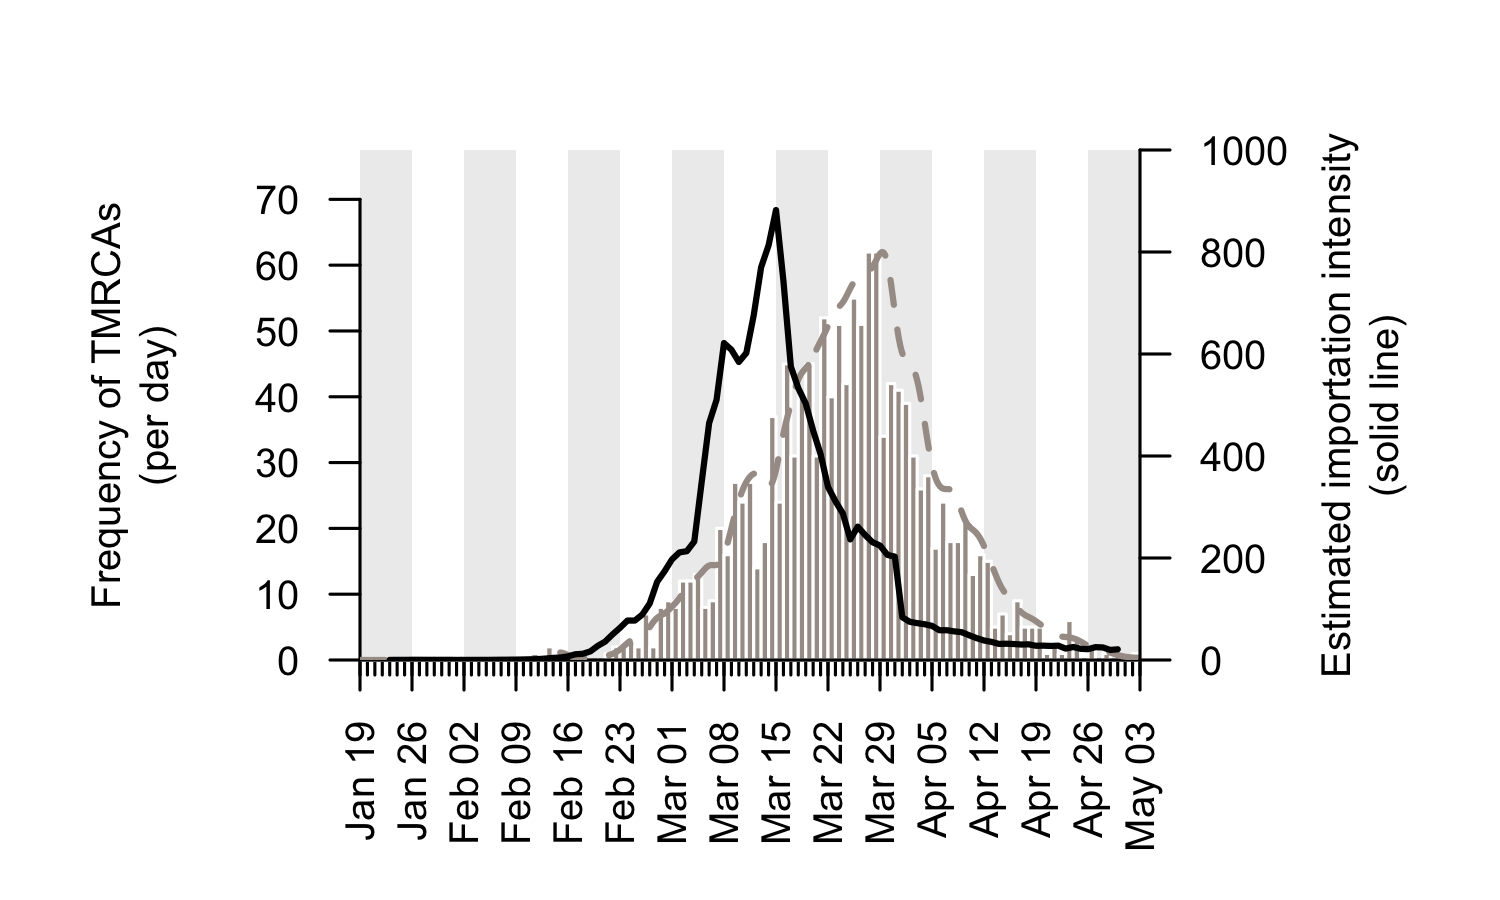
Figure 6: The estimated importation intensity (EII) curve (black line), and the histogram of UK transmission lineage TMRCAs. The average “importation lag” between the two curves is 10.7 days.
Using a statistical model we estimate the duration of the importation lag to be 10.7 days on average for all transmission lineages. However, the importation lag is expected to be shorter for large transmission lineages because the earliest transmission events within a lineage are much more likely to be observed if the lineage is well sampled (Fig. 1). Our data supports this: the estimated lag is 11.9 days for lineages of 2-5 genomes, 9.4 days for lineages of 6-15 genomes and 4.2 days for lineages >15 genomes. The latter value (4.2 days) is our best estimate of the duration between arrival of an inbound infected passenger and the first onward transmission event in the UK, and is similar to the estimated serial interval of SARS-CoV-2. By combining this statistical lag model with the estimated TMRCAs we estimate that 80% of the importation events that give rise to detectable UK transmission lineages occurred between 28th February and 29th March 2020 (the remaining 20% of imports occurred before or after these dates).
The EII is highly dynamic because it is the product of two values (number of inbound travellers and epidemic size in countries of embarkation) that vary over orders of magnitude within a matter of weeks. In early March there was a high volume of arrivals into the UK, however the countries from which most of these arrivals originated had comparatively small numbers of active infections. Towards the end of March the situation was reversed with large epidemics in many countries but a low volume of international arrivals. The mid-March peak in importation occurred because moderate levels of inbound travel coincided with highly active transmission in several European countries.
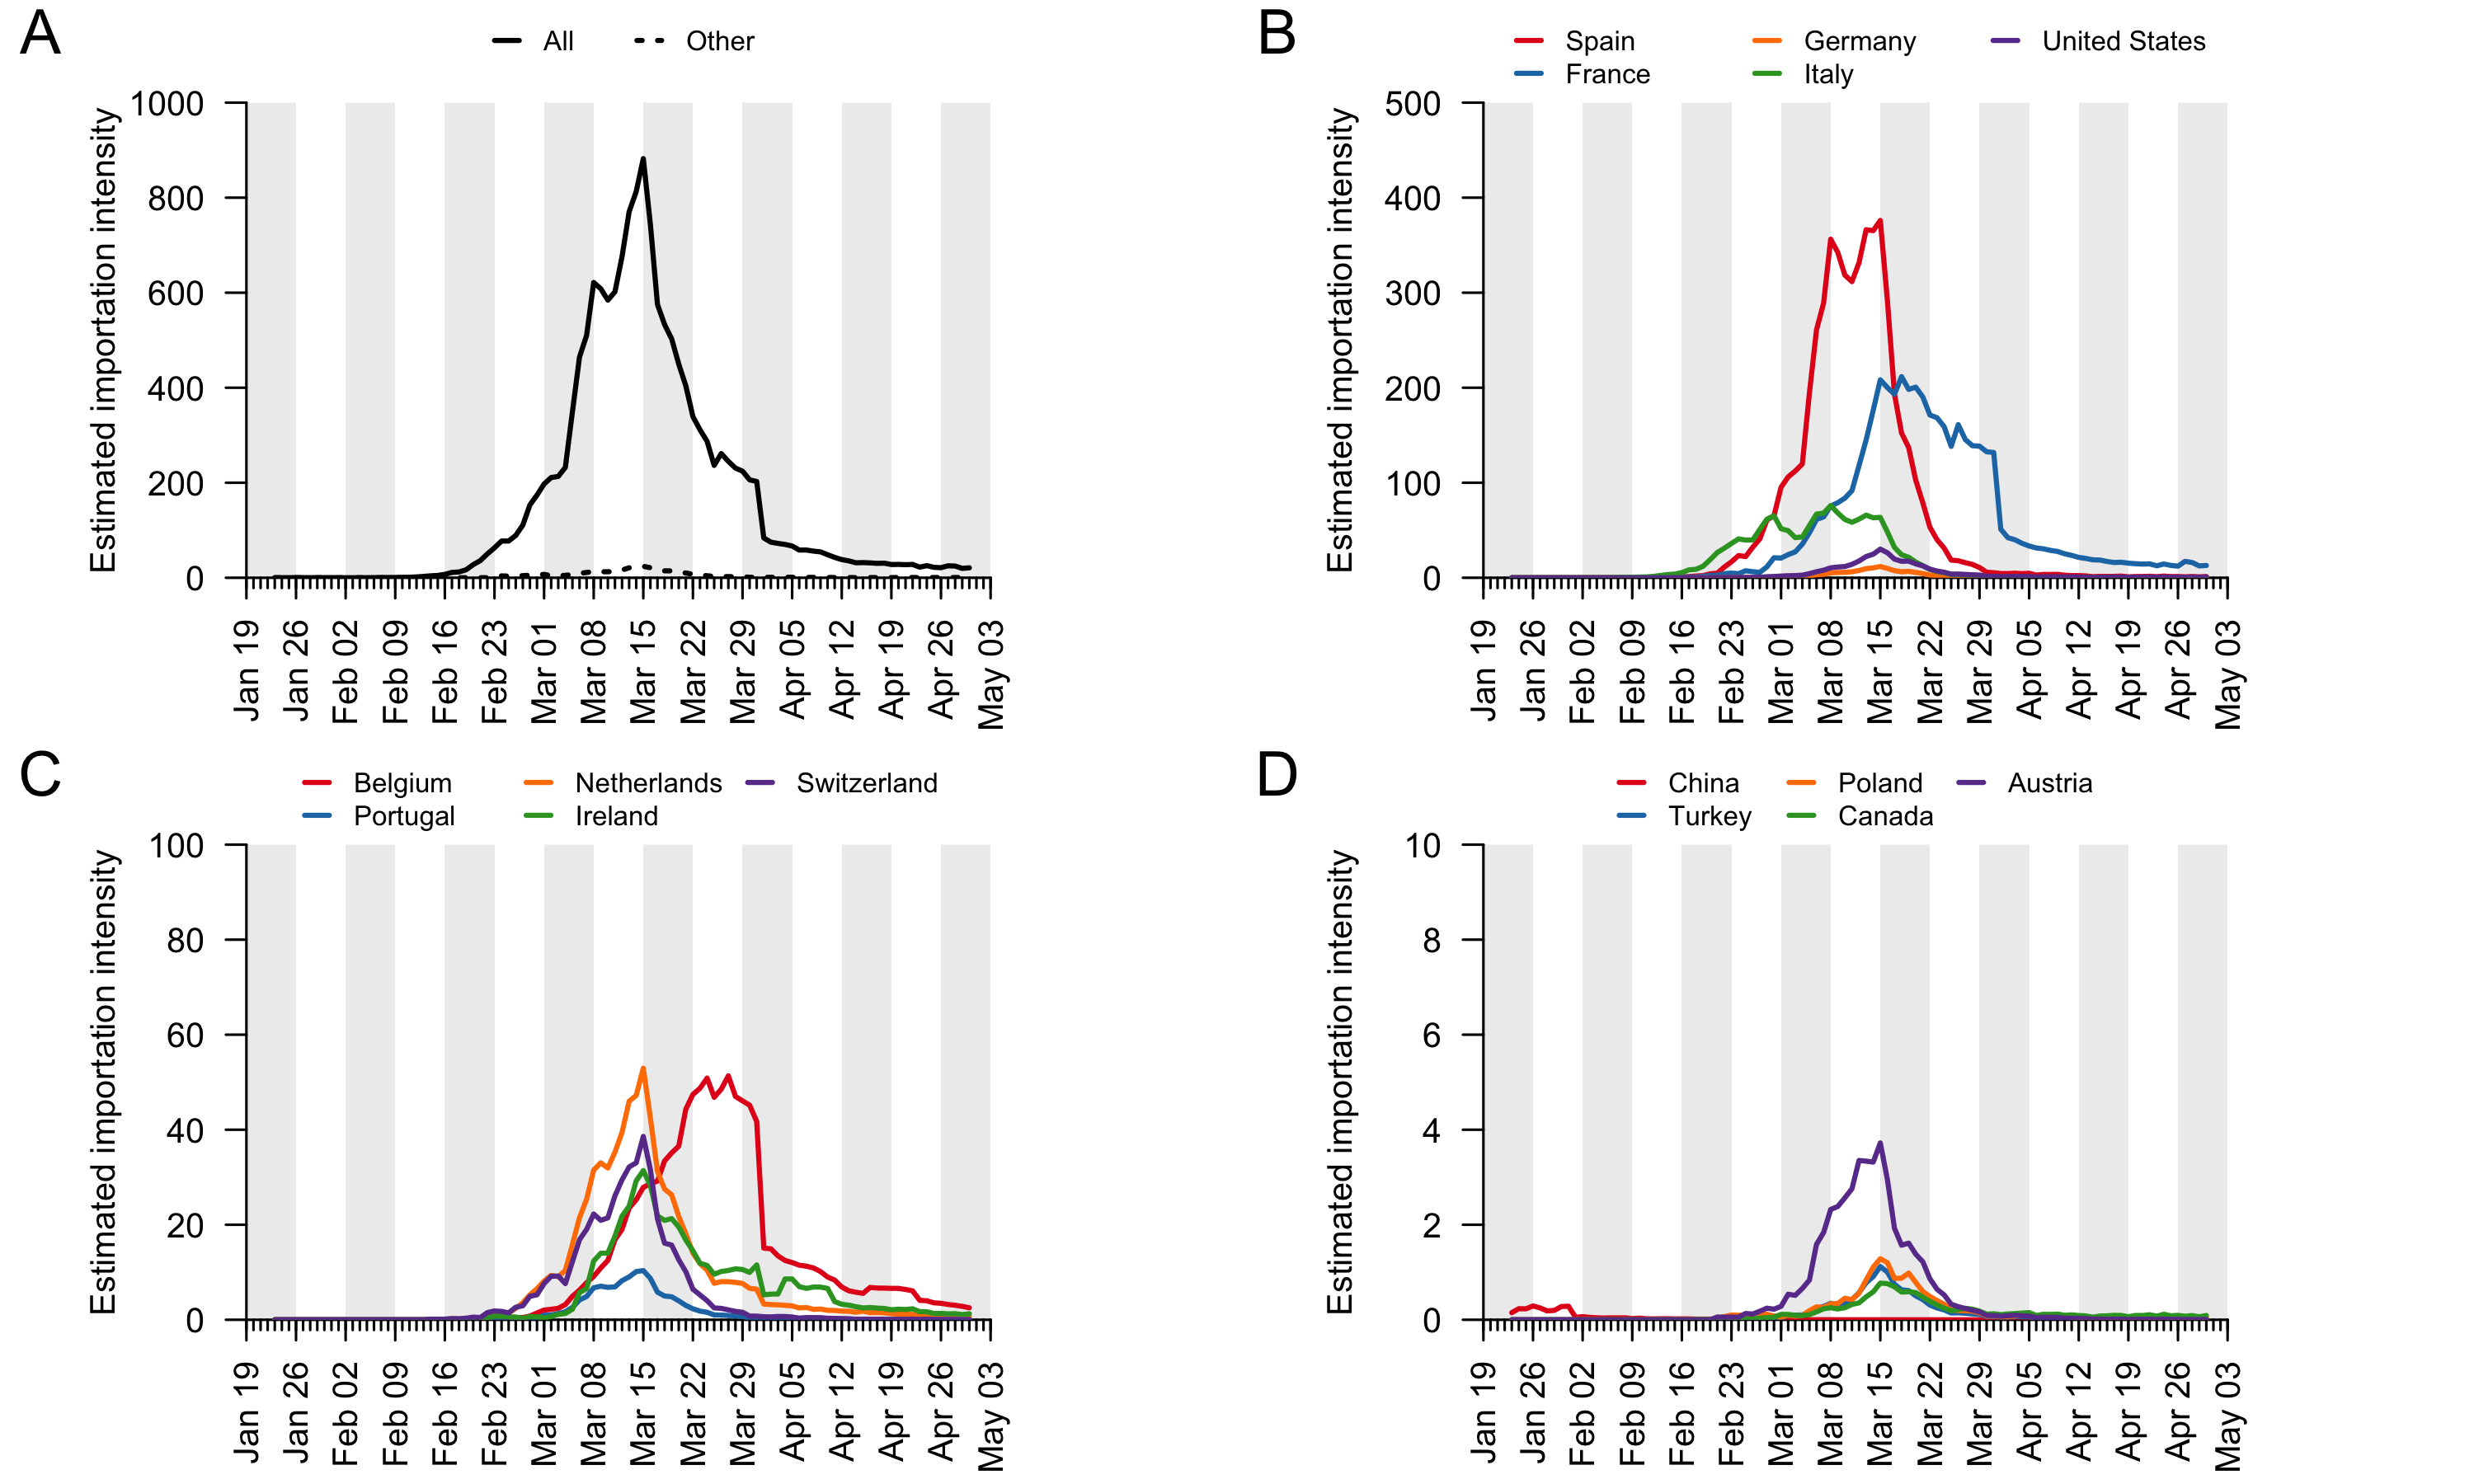
To investigate the contributions to virus introduction of travellers arriving into the UK from different countries we estimated the number of inbound travellers for those countries with both high numbers of inbound travellers and COVID-19 deaths between Jan-Apr 2020 (Appendix 3). The greatest number of inbound travellers originated from Spain and France (≈30,000 per day from each before travel declined). Italy, The Netherlands, Germany, Poland, USA, Republic of Ireland5, and Switzerland also contribute relatively high numbers of inbound travellers (Appendix 3). The volume of inbound travel (20,000 inbound passengers per day from Spain in mid-March) shows that individual events, such as football matches, likely made a negligible contribution to the overall number of imports at that time. Large-scale and longer-term trends in prevalence and mobility are much more important.
The data described above enable us to estimate a separate importation intensity (EII) for each country (Appendix 4). The date when EII peaks varies among countries. Peak importation intensity was highest for Spain because there was a window of time when large numbers of inbound travellers from Spain coincided with high prevalence there (Appendix 3). France has the second highest peak EII. These results contrast with media coverage of importations that focussed more on the earliest importation events, from China and east and southeast Asia. Early importations were indeed likely to originate from those locations but constitute a tiny fraction of all importation events that resulted in detectable UK transmission lineages. Individual-level information about travel history acquired by contact tracing will mostly relate to infections acquired before March, when importation rates were low and before the importation intensity from Spain, France, and other European countries rapidly increased. Although inbound travel from France is as frequent as from Spain (Appendix 3), the epidemic in France occurred later, by which point there were many fewer inbound travellers, hence the EII for France is lower than that for Spain.
These trends are summarised in Fig. 7, which displays, for each day, the estimated number of importation events6 (that led to a detected UK transmission lineage) that can be attributed to inbound travellers from each source country7. Early importations from China and Italy are, by early March, surpassed in number by importations from inbound travellers from Spain. The diversity of source locations also increases in March, with smaller numbers of importations attributed to a growing range of countries. In late March, the number of imports declines whilst the estimated relative contribution of travellers from France increases. The relative contribution of cross-channel movement to all international arrivals likely increased through time due to the collapse in inbound air travel.
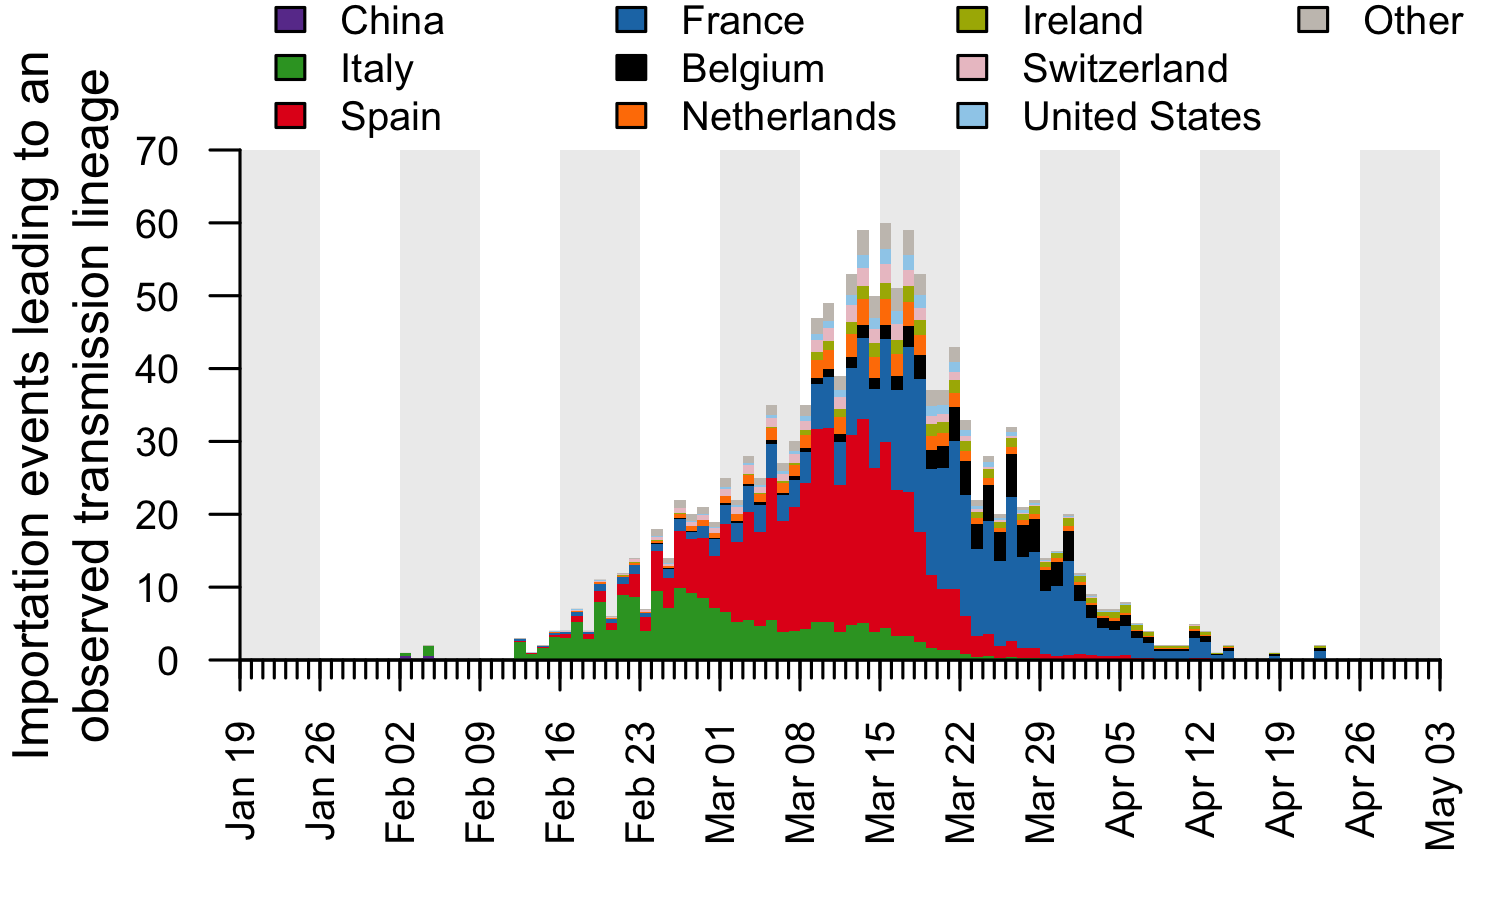
Figure 7: The estimated number of importation events that are attributable to inbound travellers from each of several source countries. Values shown are per day and not cumulative. Estimated dates of importations are obtained by combining the size-dependent importation lag model with the TMRCAs. Note that this is a statistical inference of the overall importation process, and cannot ascribe a specific source location to any given UK lineage7.
By compiling the estimated importations through time, we estimate the fraction of detected UK transmission lineages that can be attributed to each country (Fig. 8). We estimate that ~34% of lineages arrived via inbound travel from Spain, 29% from France, 14% from Italy, and 23% from other countries8. Notably the contribution of China and other Asian countries to the number of detected transmission lineages was very small.
In summary, intensive sequencing of SARS-CoV-2 genomes reveals a high frequency of virus importations that led to onward transmission within the UK. Both the rate and source of virus importations fluctuate rapidly through time. We expect that similar trends in SARS-CoV-2 importation also occurred in other countries and regions that are highly connected by international travel, although these trends may be less apparent if fewer virus genomes are generated from those locations. The relative contributions of SARS-CoV-2 importation and local transmission to early epidemic growth in each country therefore warrants further investigation. These dynamics should be taken into account when planning and modelling future public health actions in the context of international travel.
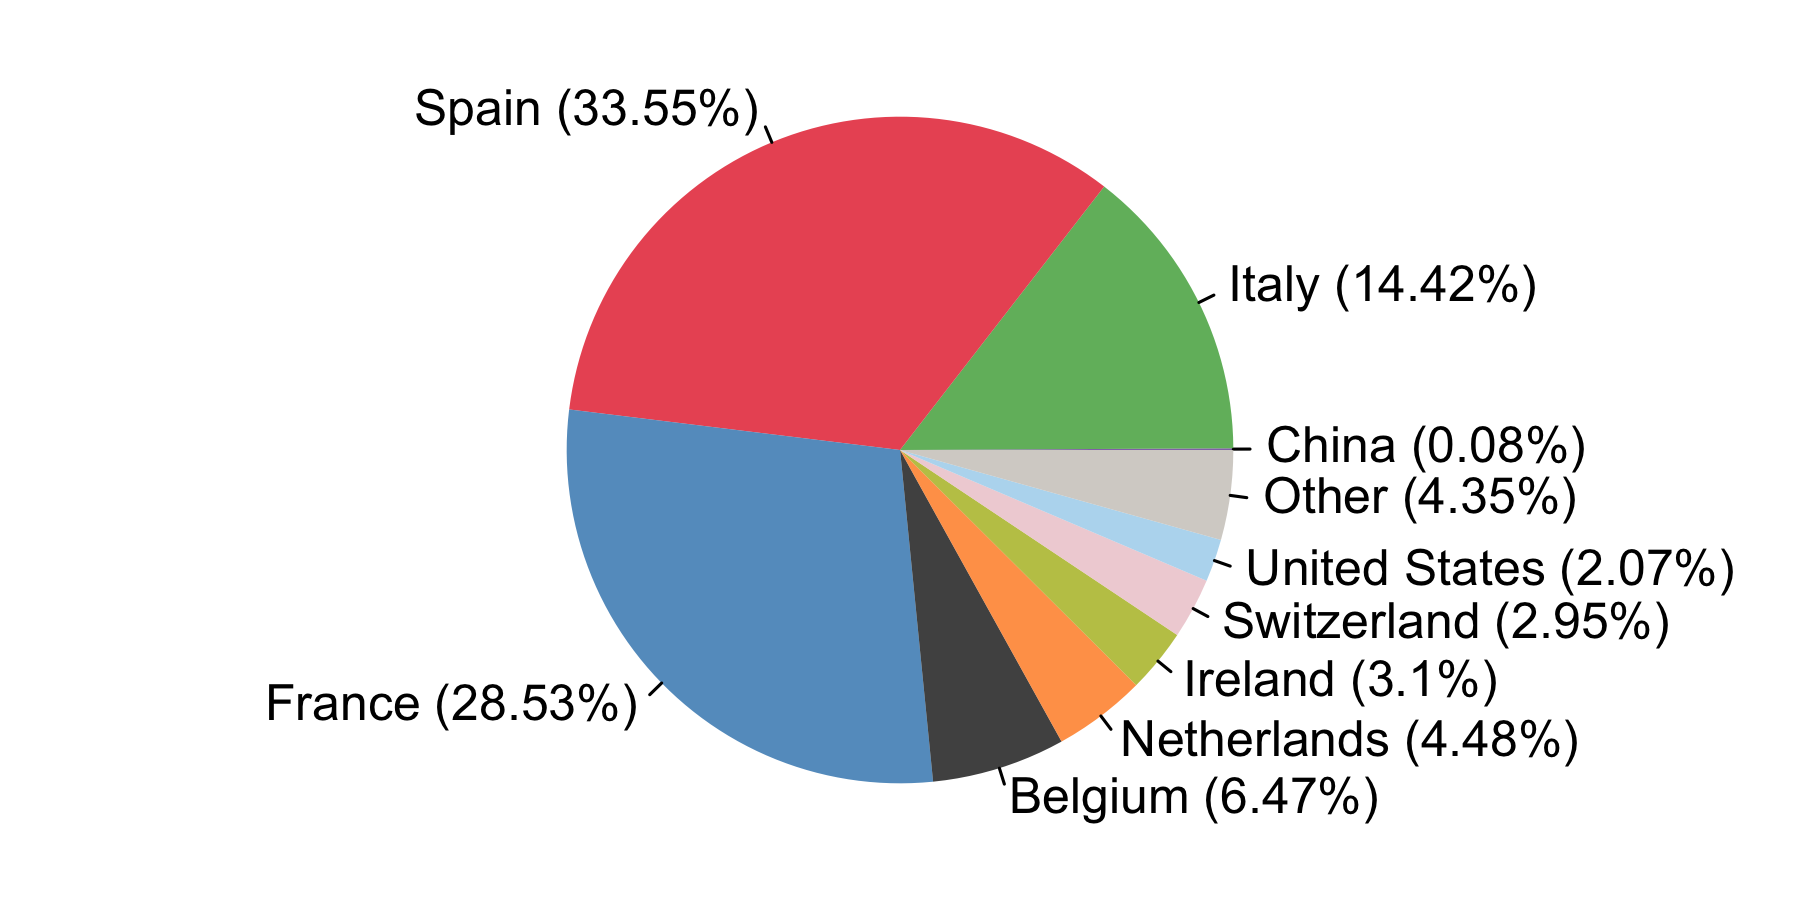
Figure 8: The estimated fraction of importation events that are attributable to inbound travellers from each country.
Limitations
A limitation of this preliminary analysis is that our estimates do not capture all the statistical uncertainty involved. The analytical framework used here is newly developed and it will take time before we can incorporate all sources of uncertainty in a statistically rigorous manner. The estimates reported here are preliminary and we focus on reporting results that we believe are robust. We have undertaken sensitivity analyses for several parameters and have compared our estimates of SARS-CoV-2 prevalence with those from more sophisticated model-based approaches. We are undertaking further work to explore the sensitivity of our results to the different ways in which UK-specific subtrees (lineages) are identified within the global SARS-CoV-2 phylogeny. Our estimates of the number of infectious individuals in each country are naïve and could be improved. For example, we assume that the probability of a traveller from country X being infectious is the same as that of a member of the general population of country X on the same day. This may be unrealistic when prevalence and rate of inbound travel vary among regions in a country. Our estimates of international rail passenger numbers are more uncertain than those for air and sea travel. The EII represents the varying likelihood of the introduction of infections into the UK but does not model the probability that an infectious arrival will initiate a local transmission lineage. Further work is needed to understand what factors might affect this probability of establishment. We intend to explore further how the number and size of UK transmission lineages observed in our sample relates to the actual number and size of transmission lineages in the general population.
Acknowledgements
We thank all partners of and contributors to the COG-UK consortium, who are listed at https://www.cogconsortium.uk/about/. We acknowledge support from the Oxford Martin School. We thank Prof Christopher Dye for helpful comments and feedback. We thank Alexander Watts, Kamran Khan and Isaac Bogoch for assistance with global aviation statistics. We also acknowledge the important work of SARS-CoV-2 genome data producers globally contributing sequence data to the GISAID database.
Footnotes
-
As the UK’s epidemic grew, it also became an exporter of virus lineages to other countries, e.g. to Iceland.
-
On average, about 50% of inbound travellers during 2020 are British nationals.
-
Our analysis is based on data available on 22/5/20, which comprised 16506 UK SARS-CoV-2 genomes and 11889 SARS-CoV-2 genomes sampled from other countries worldwide.
-
Identifying UK-specific transmission lineages of SARS-CoV-2 is a complex problem. The estimated number of introduced lineages is likely to be conservative because we have virus genome sequences for only a small fraction of UK infections (perhaps 1-5%), hence many transmission lineages will have gone undetected; larger lineages are more likely to be detected than smaller ones. Furthermore (i) under-sampling of genomes from other countries will result in the mistaken aggregation of separately-introduced UK lineages, reducing the number of detected lineages, and (ii) 42% of UK genomes (n=6954) cannot be allocated to a UK transmission lineage on the basis of virus genetic relatedness (singletons). However, given the rate of SARS-CoV-2 genome evolution and the low fraction of sequenced, some of these singletons are likely to belong to UK transmission lineages (detected or undetected).
-
Our estimates do not include travel across the land border with the Republic of Ireland. See Summary of Methods for details.
-
These are inferred dates of importation (obtained by combining the estimated TMRCAs with the importation lag model).
-
Note that these estimates are not based on virus phylogeography (a technique we have used in previous studies). We find that, for many UK transmission lineages, the virus phylogeny is currently not sufficiently informative about likely locations of origin, due to low virus genetic variation relative to rates of international movement, and to variable rates of genome sampling among locations. Further genome sequencing around the world may improve this situation in the future.
-
Since the sizes of transmission lineages vary considerably, this result does not imply that 34% or 29% of UK cases were descended from importations from Spain or France, respectively.