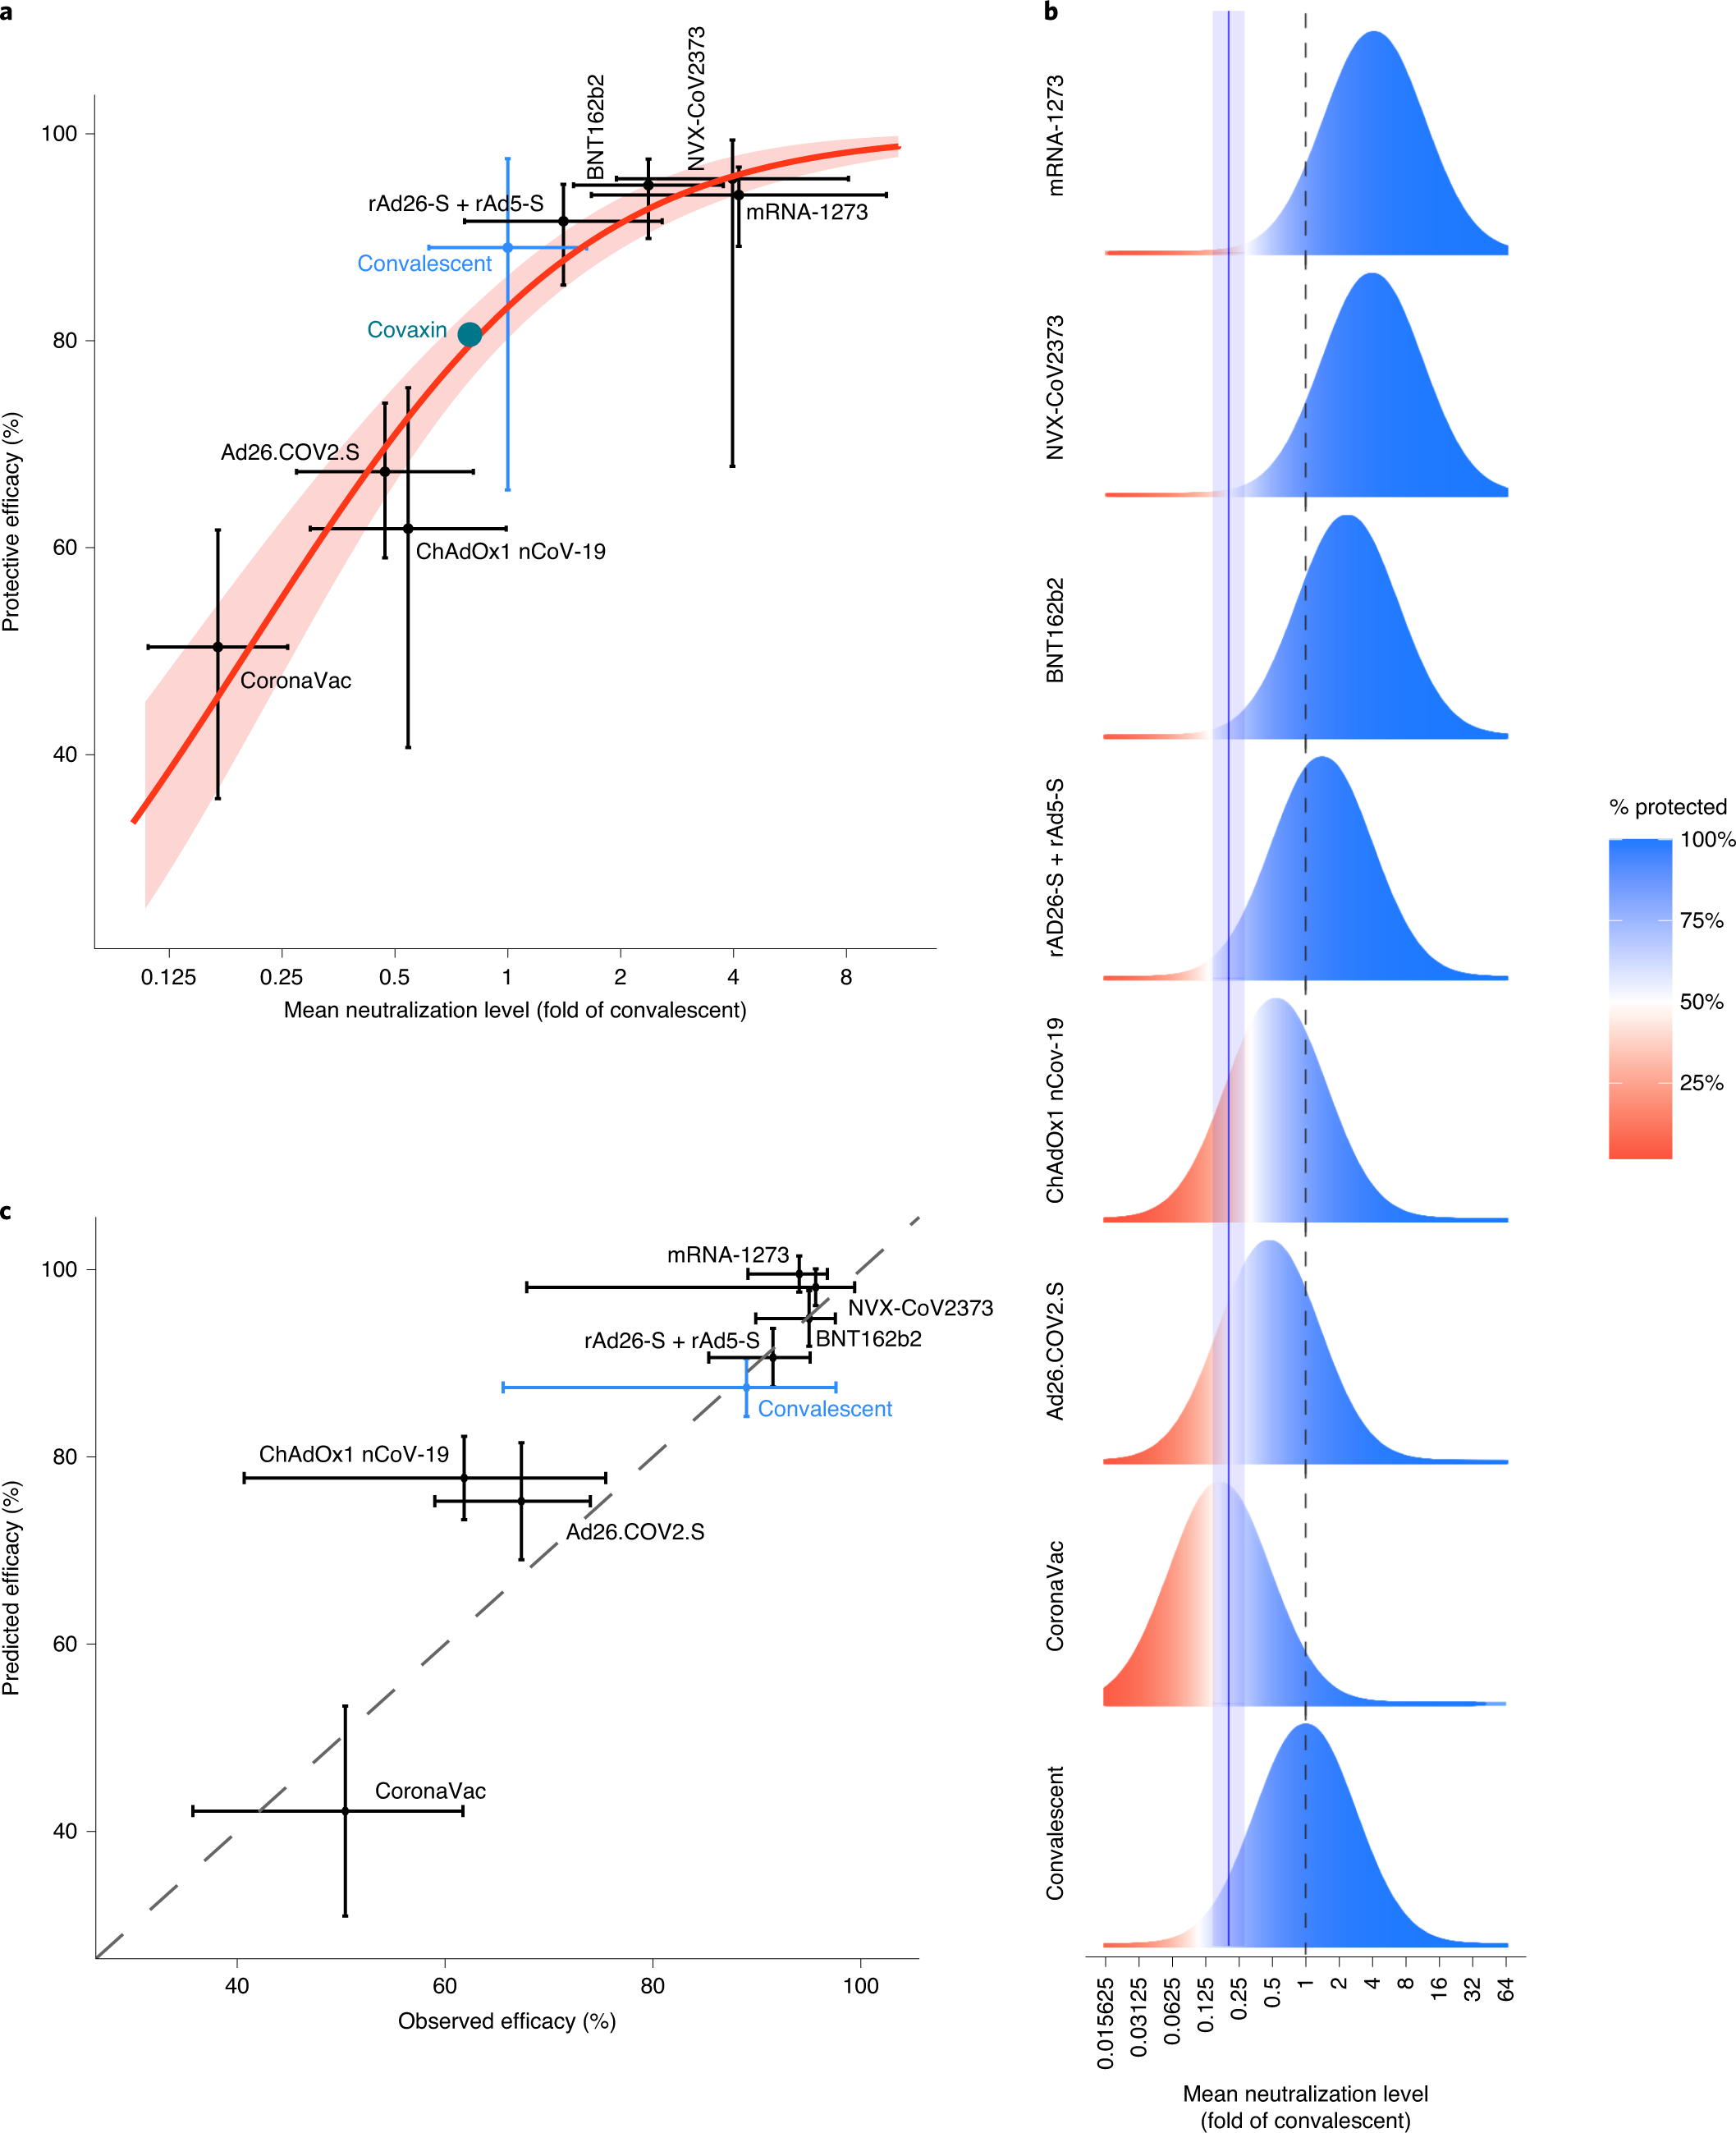
Fig. 1: Understanding the relationship between neutralization and protection.

a, Relationship between neutralization level and protection from SARS-CoV-2 infection. The reported mean neutralization level from phase 1 and 2 trials and the protective efficacy from phase 3 trials for seven vaccines, as well as the protection observed in a seropositive convalescent cohort, are shown (details of data sources are given in Supplementary Tables 1 and 2). The 95% CIs are indicated as vertical and as horizontal whiskers. The red solid line indicates the best fit of the logistic model and the red shading indicates the 95% predictive interval of the model. The mean neutralization level and protective efficacy of the Covaxin vaccine are indicated as a green circle (data from this study were available only after modeling was complete and did not contribute to fitting). b, Schematic illustration of the logistic approach to identifying the protective neutralization level. The data for each study include the distribution of the measured in vitro neutralization titer against SARS-CoV-2 in vaccinated or convalescent subjects (as a proportion of the mean titer in convalescent subjects (dashed line)) (blue/red bell curve), accompanied by a level of protective efficacy for the same regimen. The efficacy is illustrated by the proportions of the bell curve ‘protected’ (blue) and ‘susceptible’ (red) for individual studies. The modeling fits the optimal 50% protective neutralization level (blue solid line, the shaded area indicates the 95% CI) that best estimates the correct levels of protection observed across the different studies. c, Predictions of the leave-one-out analysis. Modeling was repeated multiple times using all potential sets of the seven vaccination studies and the convalescent study to predict the efficacy of the eighth study. The diagonal dashed line indicates the position of a 1:1 correlation (i.e., the relationship if the model were completely accurate). The horizontal whiskers indicate 95% CIs and the vertical whiskers indicate 95% predictive intervals.
